Database Connections & Pooling — Why 5,000 Connections Melt Postgres
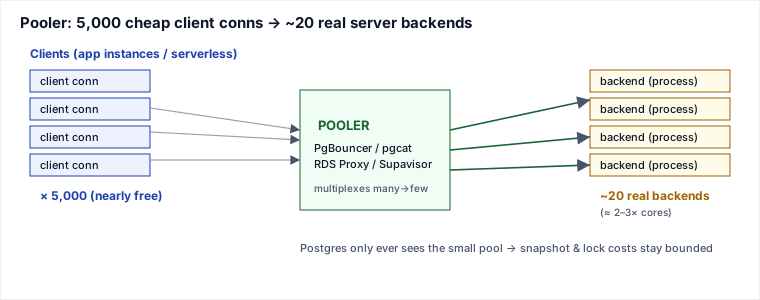
A database connection is not a free handle. In PostgreSQL it is an operating-system process, forked by the postmaster the moment a client authenticates, and it lives for the whole duration of that client's session — even when that session is doing nothing at all. That single design choice — process-per-connection — is the reason a fleet of application servers (or a swarm of serverless functions) that naively opens 5,000 connections can take a Postgres box to its knees while the CPU graph looks almost calm. The fix is not "add RAM" or "raise max_connections"; it is to put a connection pooler between the clients and the server so that thousands of client connections multiplex onto a few dozen server connections. This page builds the mechanism from the process model up.
The mechanism: a connection is a process, and processes are not free
When a client connects to PostgreSQL, the postmaster fork()s a dedicated backend process to serve it. Everything that connection does — parsing, planning, executing, holding a snapshot — happens in that process. The cost has three parts, and none of them go to zero when the connection is idle:
- Private memory. Each backend carries its own copy of catalog/system caches (
relcache,catcache: the cached shapes of tables, indexes, functions the session has touched), a plan cache, parser/executor state, and OS per-process overhead (page tables, kernel structures, stack). This is commonly ~2–10 MB of resident private memory per backend, and it grows the more distinct tables and prepared statements the session touches. Multiply by thousands of connections and you are spending gigabytes just to hold connections open. - Per-operation work memory.
work_memis allocated per sort / hash / materialize node, per connection, not globally. A single query with three hash joins andwork_mem = 64 MBcan transiently allocate3 × 64 = 192 MB. This is why "just raisework_memandmax_connections" is dangerous: the worst case ismax_connections × nodes × work_mem, and it can exceed physical RAM, triggering the OOM killer or heavy swapping. - Shared-state coordination. Every backend registers in shared memory. It participates in snapshot computation (MVCC visibility must consider every in-progress transaction — the
ProcArrayscan cost scales with connection count) and in the lock manager (lightweight-lock and heavyweight-lock tables, buffer-mapping partitions). More backends means more contention on these shared structures, longerProcArrayscans, and more cache-line bouncing between cores — even if most of those backends are idle.
Contrast MySQL/InnoDB, which is thread-per-connection: a connection is an OS thread inside one process, sharing the address space. Threads are far cheaper to create and hold than processes, so MySQL tolerates higher connection counts before falling over — but the same fundamental ceiling applies once connections are active, because the real limiter is not the connection object, it is how many queries can make progress at once. (MySQL's thread pool and Postgres's poolers both exist to attack that second problem.)
Why throughput peaks and then degrades
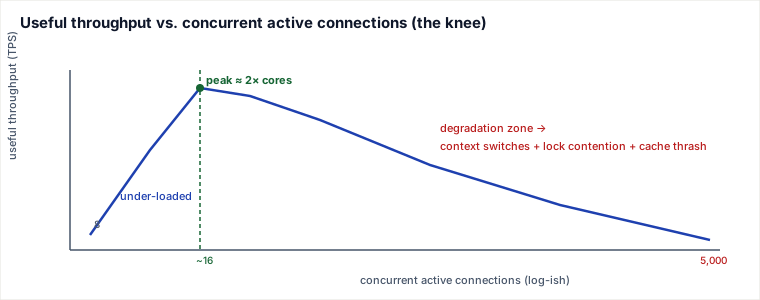
Here is the counter-intuitive part that trips people up. Useful throughput does not rise monotonically with connection count and then plateau. It rises to a peak near a small multiple of the core count, and then it declines as you add more concurrent active connections. The rule of thumb staff engineers carry: the number of connections actively executing work should be close to the number of cores, not the number of clients.
The physics: a machine with 8 cores can truly execute only 8 things at once. If 16 queries are runnable, the OS time-slices them and you are near optimal (a little over-subscription hides I/O stalls). But push to hundreds or thousands of runnable backends and three costs compound:
- Context-switching overhead — the CPU spends an increasing fraction of its cycles saving/restoring process state instead of running queries.
- Lock and latch contention — more backends fight over the same buffer-mapping locks, WAL insert locks, and row locks; time is burned spinning and sleeping rather than working.
- Cache thrash — each context switch evicts the previous backend's hot data from L1/L2/L3; effective memory bandwidth collapses as the working set no longer fits in cache.
Crucially, this collapse can happen while top shows CPU well under 100% "busy" — because the cores are stalled waiting on locks and memory, not idle by choice and not obviously pegged. That is the trap: the box looks under-utilized while throughput is on the floor.
Traced example: an 8-core box meets 5,000 connections
Take a Postgres server with 8 cores and 32 GB RAM, shared_buffers = 8 GB, work_mem = 32 MB. An application tier of 50 app instances, each with a client-side pool max of 100, opens 50 × 100 = 5,000 connections. In steady state maybe 40 of those are running a query at any instant; the other ~4,960 are idle (waiting for the app to hand them work) — but every one is a live backend process.
Memory math for the idle connections alone: at a conservative ~6 MB private RSS per backend, 5,000 × 6 MB ≈ 30 GB of memory consumed just to hold connections open — on a 32 GB box that already has 8 GB pinned in shared_buffers. You are now oversubscribed before a single heavy query runs. Add real query load — say 200 of them briefly each build a hash node — and 200 × 32 MB = 6.4 GB of transient work_mem lands on top, and the OOM killer starts reaping backends. Meanwhile the ProcArray that every snapshot must scan now has 5,000 entries, so even trivial SELECTs pay a longer visibility-check tax.
The throughput story (illustrative but realistic in shape — peak near ~2× cores, then decline). Rows are concurrent active connections, not total open:
| Active connections | Useful throughput (TPS) | p99 latency | What's happening |
|---|---|---|---|
| 8 | ~9,000 | 4 ms | one query per core; near-ideal |
| 16 | ~12,000 (peak) | 7 ms | slight oversubscription hides I/O stalls |
| 32 | ~11,000 | 18 ms | past the knee; latency climbing |
| 64 | ~8,500 | 60 ms | context-switch + lock contention biting |
| 256 | ~4,500 | 420 ms | cache thrash; cores stalled, not idle |
| 5,000 | ~1,200 | multiple seconds | collapse: memory pressure, ProcArray scans, lock storms |
The lesson: 5,000 connections deliver less real work than 16 did, at 1000× the tail latency — and the CPU meter never told the honest story. The fix is to stop letting 5,000 clients each hold a backend.
The fix: an external pooler multiplexes clients onto few backends
A connection pooler (PgBouncer, pgcat, Supabase's Supavisor, or AWS RDS Proxy) sits between the clients and Postgres. Clients open connections to the pooler — cheaply, because a PgBouncer client connection is just a lightweight entry in a single-process event loop, not a Postgres backend. The pooler maintains a small pool of real server backends (say 20–40) and hands one to a client only for as long as it actually needs to run SQL, then returns it to the pool for the next client. Five thousand idle clients now cost the pooler a few kilobytes each and cost Postgres nothing — because they are not attached to a backend at all.
Pooling modes — and exactly what breaks in each
The pooler's power comes from how aggressively it can reuse a server backend across clients. There are three modes, trading multiplexing against how much session state survives.
- Session pooling. A server backend is assigned to a client for the entire lifetime of the client's connection, and released only when the client disconnects. This is the safest mode — it behaves exactly like a direct connection, so every session feature works — but it gives the least multiplexing: you still need roughly as many backends as you have concurrently-connected clients. Useful mainly to cap the absolute ceiling and to reuse expensive-to-establish connections.
- Transaction pooling. A server backend is assigned to a client only for the duration of a single transaction, then returned to the pool the instant that transaction commits or rolls back. This gives enormous multiplexing — thousands of clients over a couple dozen backends — because between transactions a client holds nothing. It is the default reason to run PgBouncer. But it breaks any state that lives on the backend beyond a transaction boundary, because your next transaction may land on a different backend that never saw that state:
- Session-level
SET(e.g.SET search_path,SET timezone,SET statement_timeout) — set in one transaction, silently gone in the next. - Server-side prepared statements —
PREPARElives on one backend; a laterEXECUTEon another backend fails or re-plans (see below). - Advisory locks held at session scope, WITH HOLD cursors, and temp tables — all bound to a backend the next transaction won't have.
- LISTEN/NOTIFY — the
LISTENregisters on a backend you no longer own, so notifications are lost.
- Session-level
- Statement pooling. The backend is returned after every single statement — even more aggressive. This forbids multi-statement transactions entirely (autocommit only) and is a niche mode for pure single-statement workloads.
The prepared-statement / plan-cache tension
Server-side prepared statements are a real performance feature: PREPARE once, then EXECUTE many times, reusing the parsed and (often) planned query so you skip parse+plan cost per call. The plan is cached in the backend process. This collides head-on with transaction pooling: the backend holding your prepared statement is handed to another client the moment your transaction ends, so the next EXECUTE may hit a backend that has never heard of statement S — you get prepared statement "S" does not exist.
Historically this forced you to choose: transaction pooling or server-side prepared statements, not both. Two escapes exist today: (1) tell the client/driver to disable server-side prepared statements and send parameterized SQL each time (JDBC prepareThreshold=0) — you keep multiplexing but lose plan reuse; or (2) use a pooler with protocol-level prepared-statement support — PgBouncer 1.21+ (and pgcat/Supavisor) can transparently track named prepared statements and re-prepare them on whichever backend a client lands on, so the driver believes it has one persistent prepared statement while the pooler maintains it across the pool. That closes the tension, but only if you run a pooler version that supports it and enable max_prepared_statements.
The serverless angle: a connection per instance is a connection storm
This is the most common way teams rediscover the problem in production. Serverless platforms (AWS Lambda, edge functions, Cloud Run) scale by spinning up many short-lived, independent instances, each with its own runtime and its own DB client. There is no shared process to pool within, so under a traffic spike you can get thousands of instances each opening its own Postgres connection — and, worse, opening and closing them rapidly, so Postgres pays the fork()/auth/teardown cost over and over. The database hits max_connections ("remaining connection slots are reserved for non-replication superuser connections"), legitimate traffic is refused, and the incident is on.
The mitigations, in order of preference: put a pooler that can absorb bursty short-lived clients between the functions and the DB — RDS Proxy (AWS-managed, holds a warm pool and survives Lambda scale-out), Supabase's pooler, or PgBouncer/pgcat you run yourself; or use a data API / HTTP query layer (Neon's serverless driver over HTTP/WebSocket, Supabase PostgREST, Cloudflare Hyperdrive) so the function makes a stateless HTTP call and the connection pool lives server-side. The anti-pattern is a plain TCP connection opened per invocation with no pooler — it does not survive scale-out.
Pitfalls a working engineer actually hits
- Raising
max_connections"to be safe." It is not a safety valve — it raises the ceiling on the damage. A biggermax_connectionspre-allocates larger shared structures (lock tables,ProcArray), lengthens snapshot scans, and simply permits more backends to pile on and thrash. The right move is almost always a lower effective concurrency via a pooler, not a higher limit. - App-side pool max × replica count > server capacity. Each app instance's HikariCP
maximumPoolSizemultiplies by the number of instances.maximumPoolSize=50across 40 pods is 2,000 potential connections against a DB sized for 100. The pool max must be reasoned about fleet-wide, or fronted by a shared external pooler that enforces the real ceiling. - Transaction pooling silently breaking
SET search_path/ prepared statements. It fails intermittently and confusingly, because it depends on which backend you land on. Symptoms: "prepared statement does not exist," wrong schema resolved, timeouts not applied. Audit for any reliance on session state before enabling transaction mode. - Idle-in-transaction connections. A client that runs
BEGIN, does a little work, then stalls (waiting on an external API, a slow app path, or a bug) holds its locks and pins the xmin horizon — the oldest snapshot the system must preserve. That blocks VACUUM from reclaiming dead tuples across the whole database, causing table/index bloat and eventually transaction-ID wraparound risk. Always setidle_in_transaction_session_timeout; watchstate = 'idle in transaction'inpg_stat_activity.
Selection & trade-offs: no pooler vs client-side pool vs external pooler
Three points on the spectrum, each winning in a different regime:
- No pooler (raw connections). Simplest; no extra hop, no extra process to operate. Fine only for a fixed, small set of long-lived clients whose total connection count you fully control and that stays near optimal concurrency (batch jobs, a single monolith). Falls apart the moment client count is dynamic or large.
- Client-side pool (HikariCP, pgx pool, SQLAlchemy pool). Lives inside each app process; reuses a fixed set of connections so you skip per-request connect cost and cap that instance's concurrency. Gains: near-zero latency (no extra network hop), dead simple to deploy, connection reuse. Costs: the pool is per-instance, so it cannot enforce a fleet-wide ceiling — 40 instances × a generous max is a storm; and it cannot multiplex across instances or absorb serverless scale-out. Best when you run a bounded, known number of long-lived app processes.
- External transaction pooler (PgBouncer / pgcat / RDS Proxy). A shared chokepoint that enforces the true server ceiling regardless of how many clients appear, and multiplexes thousands of clients (including bursty serverless) onto a small backend pool. Gains: fleet-wide ceiling, massive multiplexing, survives scale-out. Costs: an extra network hop and a component to run/monitor, and transaction mode's session-state restrictions. Best when client count is large, dynamic, or serverless — which is most modern deployments. The two layers compose: HikariCP inside each app for reuse, an external pooler in front of Postgres for the global ceiling.
HikariCP sizing — why small pools win. The HikariCP "About Pool Sizing" wiki argues from the same physics as the knee above: a pool much larger than the database can concurrently service only adds queueing and context-switch overhead, not throughput. Its formula:
connections = ((core_count × 2) + effective_spindle_count)For an 8-core server backed by SSD/NVMe (effective spindle count ≈ 1), that is (8 × 2) + 1 = 17 connections — startlingly small next to a naive "hundreds." The × 2 oversubscribes just enough to keep cores busy while some connections wait on disk/network; effective_spindle_count reflects how many concurrent I/Os the storage can serve. The counter-intuitive result HikariCP demonstrates: a pool of ~10 can out-throughput a pool of thousands, at a fraction of the latency — the same lesson as the traced table, expressed as a sizing rule.
Takeaways
- In PostgreSQL a connection is an OS process with several MB of private memory plus a share of snapshot and lock-manager overhead — idle connections are not free, and thousands of them cost tens of GB and slow every query's visibility check.
- Useful throughput peaks near ~2× cores and then degrades from context-switching, lock contention, and cache thrash — often while CPU looks under-utilized. Active concurrency, not client count, is the number to control.
- An external pooler multiplexes many client connections onto a few backends; transaction pooling gives the most multiplexing but breaks anything that outlives a transaction (
SET, session prepared statements, advisory locks, temp tables, LISTEN/NOTIFY) unless the pooler speaks protocol-level prepared statements. - Serverless fan-out needs a pooler (or a data API) by construction — per-instance connections become a connection storm under scale-out.
- Don't raise
max_connectionsto cope; lower effective concurrency. Size client pools fleet-wide (HikariCP:(cores × 2) + spindles) and front Postgres with a shared pooler that enforces the real ceiling.
Citations
- PgBouncer documentation — pooling modes (session/transaction/statement) and prepared-statement support:
pgbouncer.org/features.html,pgbouncer.org/config.html. - HikariCP wiki, "About Pool Sizing" — the
(core_count × 2) + effective_spindle_countformula and why small pools win:github.com/brettwooldridge/HikariCP/wiki/About-Pool-Sizing. - PostgreSQL documentation — connection/process model and resource consumption: "How Connections Are Established" and "Resource Consumption" (
work_mem,shared_buffers,max_connections). - AWS — Amazon RDS Proxy developer guide (managed pooling for Lambda/serverless connection management).
🤖 Don't fully get this? Learn it with Claude
Stuck on Database Connections & Pooling — Why 5,000 Connections Melt Postgres? Open Claude, copy a block below, and it'll teach you this exact concept — visually and interactively.
Build the mental picture, not memorization.
I just read a lesson on **Database Connections & Pooling — Why 5,000 Connections Melt Postgres** (Databases) and want to truly understand it. Explain Database Connections & Pooling — Why 5,000 Connections Melt Postgres from first principles using ONE vivid real-world analogy and a visual mental model — draw it as ASCII art or a clear step-by-step diagram — with a concrete example using real numbers. Then ask me one question to check I got the mental picture, and wait for my reply. If you're unsure or a claim isn't standard, say so and reason from first principles instead of guessing.
Socratic — adapts to where you're stuck.
Teach me **Database Connections & Pooling — Why 5,000 Connections Melt Postgres** interactively. Ask me ONE guiding question at a time, wait for my answer, and adapt to my confusion — build the idea with me step by step instead of explaining it all at once. If you're unsure or a claim isn't standard, say so and reason from first principles instead of guessing.
Active recall exposes what you missed.
Quiz me on **Database Connections & Pooling — Why 5,000 Connections Melt Postgres** with 5 questions, easy to tricky, ONE at a time. Tell me if each answer is right; at the end, explain clearly what I got wrong and why. If you're unsure or a claim isn't standard, say so and reason from first principles instead of guessing.
Intuition + hook + flashcards for long-term memory.
Help me remember **Database Connections & Pooling — Why 5,000 Connections Melt Postgres** for the long term: give the one-sentence intuition, a memorable hook/mnemonic, a tiny worked example, and 3 active-recall flashcards (Q -> A). If you're unsure or a claim isn't standard, say so and reason from first principles instead of guessing.