How a Query Executes — Parse, Plan, Run & EXPLAIN
What happens between SELECT and the rows coming back
You send SQL; the database doesn't run it literally — it compiles it into an execution plan and runs that. Understanding the pipeline is what lets you make slow queries fast.
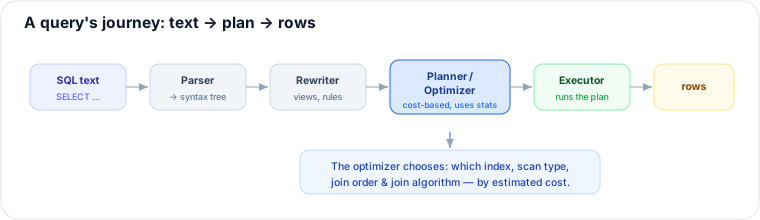
The four stages
- Parse — SQL text → syntax tree (catch typos, resolve table/column names).
- Rewrite — The rewriter applies rules to transform the query. Key optimizations here include:
- View Expansion: If a query references a view, the rewriter expands the view's definition and substitutes the underlying tables and filters directly into the query tree.
- Subquery Flattening (Unnesting): Subqueries like
WHERE user_id IN (SELECT user_id FROM orders)are flattened into aSEMI JOIN, allowing the optimizer to evaluate better join orderings and indexing strategies.
- Plan / Optimize — The heart of execution compilation. The optimizer operates in two distinct phases:
- Logical Plan Generation: Translates the rewritten query into a declarative tree of relational algebra operations (e.g., Projection $\pi$, Selection $\sigma$, Join $\bowtie$, Scan) without choosing concrete implementation algorithms.
- Physical Plan Selection: Evaluates various concrete algorithms for each node in the logical plan (e.g., deciding whether to do an Index Scan or Seq Scan, or joining using a Hash Join or Nested Loop Join). The cost-based optimizer (CBO) estimates the resource consumption of each candidate using table statistics (row counts, histograms, MCV lists) and outputs the cheapest physical plan for the executor.
- Execute — The executor runs the chosen physical plan by executing a tree of physical operator nodes (e.g., in a Volcano-style demand-driven pipeline pulling rows from child operators).
Reading EXPLAIN — the plan the optimizer chose
EXPLAIN shows the plan; EXPLAIN ANALYZE also runs it and reports real timings.
Read it bottom-up — leaf operators execute first.
EXPLAIN ANALYZE SELECT * FROM orders WHERE user_id = 7;

-- BEFORE an index:
Seq Scan on orders  (cost=0..18334  rows=12  width=64)
                    (actual time=0.2..86.4ms  rows=12)      <- scanned 1,000,000 rows to find 12

-- AFTER  CREATE INDEX ON orders(user_id);
Index Scan using orders_user_id on orders
                    (cost=0.4..33  rows=12)  (actual time=0.05..0.11ms  rows=12)  <- ~800x faster
Each node shows estimated cost, estimated rows, and (with ANALYZE) actual time + actual rows. The number that matters most:
If estimated rows is wildly different from actual rows, the optimizer is
working from stale statistics and likely chose a bad plan. Run ANALYZE (refresh stats)
and re-check.
Cost is two numbers: startup vs total
Postgres cost is reported as cost=startup..total (arbitrary units, not milliseconds). Startup cost is work before the first output row; total cost is work to produce the whole result. With LIMIT, the planner optimizes for early rows — a nested-loop + index that has low startup can beat a hash join with high startup even when the hash would win for the full result set. Reading only total without the LIMIT context mis-diagnoses "why did it pick nested loop?"
-- Planner may prefer Nested Loop for LIMIT 10 even if Hash Join is cheaper for all rows:
EXPLAIN SELECT * FROM orders o JOIN users u ON o.user_id = u.id
WHERE o.status = 'open' ORDER BY o.created_at DESC LIMIT 10;
-- Look for: low startup on the chosen plan; Index Scan feeding Nested Loop
Selectivity crossover: when the planner ignores your index
An index is not free: each hit may mean random I/O (and a secondary-index hop to the heap). The planner estimates selectivity (fraction of rows matching the predicate) from statistics. Rough rule of thumb:
- Highly selective (e.g. 0.01% of rows) → Index Scan almost always wins.
- Moderately selective → depends on correlation, cache, covering index.
- Low selectivity (e.g. > ~10–30% of the table, engine-dependent) → Seq Scan can be cheaper than thrashing random index+heap reads. The planner is not "broken" when it skips your index on
WHERE status = 'active'if half the table is active.
That is the selectivity crossover: beyond a threshold, sequential I/O of the whole table beats indexed random access. Fix data model/predicates (more selective filters, partial indexes on the rare status, covering indexes) rather than forcing an index blindly with hints.
Cardinality errors propagate up the tree
A wrong row estimate at a leaf multiplies through joins. Example: leaf estimates 10 rows, actual 10,000; nested-loop parent assumes 10 probes and runs 10,000 → plan time looks fine, runtime explodes. Always compare rows (estimate) vs actual rows at every node, not only the root. Stale stats, missing extended stats for correlated columns, and underestimated join selectivity are the usual culprits.
Worked EXPLAIN cases beyond the happy path
1. Nested-loop disaster (bad estimate × no useful index)
EXPLAIN ANALYZE
SELECT * FROM orders o JOIN order_items i ON i.order_id = o.id
WHERE o.created_at > now() - interval '1 day';

-- Disaster shape (numbers illustrative):
-- Nested Loop  (cost=0.00..50  rows=100)  (actual time=0..42000 rows=2_000_000)
--   -> Seq Scan on orders  (rows=100) (actual rows=50_000)   <-- 500x underestimate
--   -> Seq Scan on order_items  (rows=1) (actual rows=40)     <-- no index on order_id
-- Each of 50k outer rows re-scans items → catastrophic.
Fix path: index order_items(order_id); ANALYZE orders; re-check whether Hash Join appears once estimates and indexes make it cheaper.
2. Hash join spill (Batches > 1)
-- Postgres EXPLAIN ANALYZE excerpt:
-- Hash Join  (actual time=12..890 rows=1_200_000)
--   Hash  (Batches=16  Memory Usage=4096kB)   <-- Batches>1 means work_mem was too small
--   -> Seq Scan on big_build_side
When the build-side hash table does not fit in work_mem, the engine partitions both sides to disk (grace/hybrid hash) and multiplies I/O. Batches=1 is healthy; growing Batches is a spill signal. Raise work_mem for the session, shrink the build side (filter earlier, build on the smaller input), or reduce width of hashed columns.
3. Estimate vs actual divergence (stale stats)
-- Seq Scan on events  (cost=0..1000  rows=100)  (actual rows=2_500_000)
-- Filter: (tenant_id = 42)
-- Rows Removed by Filter: 50_000_000
Planner thought tenant 42 was tiny (old histogram / never analyzed after bulk load). It may pick nested loops or wrong join order for every parent. ANALYZE events; then re-EXPLAIN is the first move before rewriting SQL.
What to look for
- Seq Scan on a big table with a selective filter → missing/unused index or selectivity so high a seq scan is intentional.
- Nested Loop with huge actual rows on the inner side → bad join order / missing index / cardinality underestimate.
- Sort or Hash with Batches>1 / disk spill → raise work_mem, reduce build/sort width, or add an ordered index.
- estimate ≠ actual at any node → stale or insufficient stats; fix before chasing indexes.
- LIMIT queries → compare startup cost; early-exit plans legitimately differ from full-scan plans.
Takeaways
- SQL is compiled: parse → rewrite → cost-based plan → execute.
- Cost has startup and total; LIMIT optimizes for first rows.
- Selectivity crossover explains ignored indexes; cardinality error multiplies up the tree.
EXPLAIN ANALYZEis the truth: read bottom-up; hunt estimate-vs-actual, nested-loop blowups, and hash Batches>1.
Re-authored for this guide; query-pipeline diagram hand-authored as SVG. Follows the PostgreSQL "Using EXPLAIN" docs and CMU 15-445. See also: How Indexes Work, Indexes in Practice, Join Algorithms.
🤖 Don't fully get this? Learn it with Claude
Stuck on How a Query Executes — Parse, Plan, Run & EXPLAIN? Open Claude, copy a block below, and it'll teach you this exact concept — visually and interactively.
Build the mental picture, not memorization.
I just read a lesson on **How a Query Executes — Parse, Plan, Run & EXPLAIN** (Databases) and want to truly understand it. Explain How a Query Executes — Parse, Plan, Run & EXPLAIN from first principles using ONE vivid real-world analogy and a visual mental model — draw it as ASCII art or a clear step-by-step diagram — with a concrete example using real numbers. Then ask me one question to check I got the mental picture, and wait for my reply. If you're unsure or a claim isn't standard, say so and reason from first principles instead of guessing.
Socratic — adapts to where you're stuck.
Teach me **How a Query Executes — Parse, Plan, Run & EXPLAIN** interactively. Ask me ONE guiding question at a time, wait for my answer, and adapt to my confusion — build the idea with me step by step instead of explaining it all at once. If you're unsure or a claim isn't standard, say so and reason from first principles instead of guessing.
Active recall exposes what you missed.
Quiz me on **How a Query Executes — Parse, Plan, Run & EXPLAIN** with 5 questions, easy to tricky, ONE at a time. Tell me if each answer is right; at the end, explain clearly what I got wrong and why. If you're unsure or a claim isn't standard, say so and reason from first principles instead of guessing.
Intuition + hook + flashcards for long-term memory.
Help me remember **How a Query Executes — Parse, Plan, Run & EXPLAIN** for the long term: give the one-sentence intuition, a memorable hook/mnemonic, a tiny worked example, and 3 active-recall flashcards (Q -> A). If you're unsure or a claim isn't standard, say so and reason from first principles instead of guessing.