Build an Operability Capstone — Instrument, Deploy, Break & Roll Back
Operability Capstone — Instrument, Deploy, Break & Roll Back a Live Service
Every other lab in this gym makes you build correctness. This one makes you build operability — the property that decides whether a 3am page is a two-minute rollback or a two-hour outage. It is the gym's biggest gap, and it is the skill a staff+ engineer is actually hired for: not "can you design it" but "when it's on fire and you didn't write it, can you see what's wrong and make it stop without making it worse." You cannot whiteboard this. You have to run a service, watch it break through its own instrumentation, and recover it — so this lab is deliberately runnable end-to-end in one terminal, no cloud, no dependencies to install.
The drill (read it as a page, not a puzzle): You shipped a new version of a service. Minutes later a downstream dependency fails over — it browns out (slow, then 5xx). Your p99 spikes, users complain. You have three questions and about five minutes: What do you observe? What do you roll back? How do you confirm it's healthy again? A senior answers all three from signals — metrics, health endpoints, structured logs — not by reading source. This lab builds a service that emits those signals, then breaks it under load so you practise the loop for real.
Scope it like a senior (what you establish before touching a dashboard)
- What is the user-facing symptom, in SLI terms? "p99 latency" and "error rate" are the two you'll almost always watch. Fix the numbers: what's the normal p99, what's the SLO, how much error budget is left? You alert and decide against the symptom (users getting slow/failed responses), not the cause (a specific dependency returning 500).
- Liveness or readiness? Two different questions. Liveness = "is this process wedged and does it need a restart?" Readiness = "should this instance receive traffic right now?" Conflating them is the classic outage amplifier (covered below). Establish which probe you're reasoning about.
- Fail-open or fail-closed on this dependency? When the downstream is down, do we serve a degraded-but-successful fallback (fail-open) or reject the request (fail-closed)? This is a correctness/safety decision made before the incident — it decides whether a dependency outage even shows up as errors.
- What's the fastest safe reversal? Rollback (redeploy the previous known-good), roll-forward (ship a fix), or a feature-flag kill-switch (toggle the risky path off with no deploy)? The answer depends on what the change touched — you decide this before you need it.
- What proves "recovered"? Not "it feels better." The same signals that showed the break must show the recovery: error rate back to baseline, p99 back under SLO, readiness green. If you can't measure recovery you can't declare it.
Assume for this lab: one HTTP service fronting one downstream dependency; the dependency can brown out (slow + 5xx); you can deploy two versions and toggle them; you watch three signals (error rate, p99, readiness) via a scrape endpoint; the fallback is a safe degraded read (so fail-open is defensible here). This is a Prometheus/Kubernetes-shaped service, deliberately shrunk to a single file.
Reason to the design — the four things that make a service operable
1. Metrics you can scrape. An operator can't attach a debugger to production. The service must volunteer its state: a request counter, an error counter, and a latency distribution you can read a percentile from. Averages lie (one 10s request hidden among a thousand 5ms ones vanishes into a 15ms mean); you need p50 and p99, which means keeping a distribution, not a running average. This is the write-once-read-cheap idea from the Metrics, Logs & Traces page applied to your own process.
2. Health that distinguishes liveness from readiness. /healthz answers "is the process alive?" and must not depend on downstreams — if it did, a dependency blip would make the orchestrator kill every healthy pod and turn a brownout into an outage. /readyz answers "can I serve a good response right now?" and may depend on downstreams, because the load balancer uses it to shed traffic away from an instance that can't serve.
3. Structured logs with a request id. Free-text logs are ungreppable at volume. One JSON line per request — {req_id, path, status, latency_ms, version} — lets you filter to the failing requests, correlate across services by the id, and count errors without regexing prose. The version field is what tells you, in one query, that the errors started exactly when v2 rolled out.
4. A reversible deploy lever. Operability isn't just seeing the fire; it's the switch that puts it out. A version flag (or feature flag) that flips the code path back to known-good, live, is the difference between "roll back in 30s" and "write, test, and deploy a fix while burning error budget." We model it as a runtime toggle so you can execute the rollback in the same terminal and watch the signals recover.
The service below is the smallest thing that has all four. The regression we ship in v2 is the single most common real-world reliability bug (Nygard's Release It! opens on it): a missing timeout and fallback on a downstream call. v1 has a bounded timeout and fails open; v2 removed them and fails closed. Same dependency outage; wildly different blast radius.
Build it (1) — the instrumented service in Java
Single file, no dependencies. javac OpService.java && APP_VERSION=v2 java OpService. Uses only the JDK's com.sun.net.httpserver.
import com.sun.net.httpserver.HttpServer;
import com.sun.net.httpserver.HttpExchange;
import java.io.OutputStream;
import java.net.InetSocketAddress;
import java.nio.charset.StandardCharsets;
import java.util.Arrays;
import java.util.UUID;
import java.util.concurrent.ExecutorService;
import java.util.concurrent.Executors;
import java.util.concurrent.Future;
import java.util.concurrent.TimeUnit;
import java.util.concurrent.atomic.AtomicBoolean;
import java.util.concurrent.atomic.AtomicLong;

public class OpService {
    // ---- metrics: what the operator scrapes ----
    static final AtomicLong reqTotal = new AtomicLong();
    static final AtomicLong errTotal = new AtomicLong();
    static final long[] ring = new long[4096];   // bounded latency reservoir (ms)
    static int ringIdx = 0;
    static final Object ringLock = new Object();

    // ---- operability knobs ----
    // version flag: "v1" = resilient (timeout + fail-open); "v2" = the bad deploy (no timeout, fail-closed)
    static volatile String version = System.getenv().getOrDefault("APP_VERSION", "v1");
    // dependency state: flip true to simulate a downstream failover / brownout
    static final AtomicBoolean depFailing = new AtomicBoolean(false);

    static final ExecutorService depPool = Executors.newFixedThreadPool(200);
    static final int DEP_TIMEOUT_MS = 100;

    static void recordLatency(long ms) {
        synchronized (ringLock) { ring[ringIdx % ring.length] = ms; ringIdx++; }
    }
    static long percentile(int p) {
        long[] snap; int n;
        synchronized (ringLock) { n = Math.min(ringIdx, ring.length); snap = Arrays.copyOf(ring, n); }
        if (n == 0) return 0;
        Arrays.sort(snap);
        int idx = (int) Math.ceil(p / 100.0 * n) - 1;
        if (idx < 0) idx = 0; if (idx >= n) idx = n - 1;
        return snap[idx];
    }

    // the downstream dependency. When "failing", it browns out: slow, then 5xx.
    static String callDependency() throws Exception {
        if (depFailing.get()) { Thread.sleep(800); throw new RuntimeException("dependency 5xx"); }
        Thread.sleep(10); return "ok";                         // healthy latency
    }
    // v1 path: bounded wait, degraded fallback on timeout/error (FAIL-OPEN)
    static String serveWithFallback() {
        Future<String> f = depPool.submit(OpService::callDependency);
        try { return f.get(DEP_TIMEOUT_MS, TimeUnit.MILLISECONDS); }
        catch (Exception e) { f.cancel(true); return "fallback"; }
    }

    public static void main(String[] args) throws Exception {
        int port = Integer.parseInt(System.getenv().getOrDefault("PORT", "8080"));
        HttpServer server = HttpServer.create(new InetSocketAddress(port), 0);
        server.setExecutor(Executors.newFixedThreadPool(64));

        server.createContext("/api", ex -> {
            String reqId = firstNonNull(ex.getRequestHeaders().getFirst("X-Request-Id"),
                                        UUID.randomUUID().toString());
            long start = System.currentTimeMillis();
            reqTotal.incrementAndGet();
            int status; String body;
            if ("v1".equals(version)) {                        // resilient: never surfaces the dep error
                String r = serveWithFallback();
                status = 200; body = "{\"result\":\"" + r + "\"}";
            } else {                                           // v2: the regression — no timeout, no fallback
                try { callDependency(); status = 200; body = "{\"result\":\"ok\"}"; }
                catch (Exception e) { errTotal.incrementAndGet(); status = 500;
                                      body = "{\"error\":\"dependency unavailable\"}"; }
            }
            long ms = System.currentTimeMillis() - start;
            recordLatency(ms);
            log(reqId, "/api", status, ms);
            send(ex, status, body);
        });

        // LIVENESS: process alive? cheap, no downstream check — never let a dep outage restart us.
        server.createContext("/healthz", ex -> send(ex, 200, "OK"));

        // READINESS: can I serve a good response now? v1 can (fallback); v2 can't while dep is down.
        server.createContext("/readyz", ex -> {
            boolean ready = !depFailing.get() || "v1".equals(version);
            send(ex, ready ? 200 : 503, ready ? "READY" : "NOT_READY");
        });

        // METRICS: Prometheus-style scrape.
        server.createContext("/metrics", ex -> {
            long total = reqTotal.get(), err = errTotal.get();
            double rate = total == 0 ? 0.0 : (100.0 * err / total);
            StringBuilder sb = new StringBuilder();
            sb.append("# TYPE http_requests_total counter\nhttp_requests_total ").append(total).append("\n");
            sb.append("# TYPE http_errors_total counter\nhttp_errors_total ").append(err).append("\n");
            sb.append("# TYPE http_request_latency_ms summary\n");
            sb.append("http_request_latency_ms{quantile=\"0.5\"} ").append(percentile(50)).append("\n");
            sb.append("http_request_latency_ms{quantile=\"0.99\"} ").append(percentile(99)).append("\n");
            sb.append("http_error_rate_percent ").append(String.format("%.2f", rate)).append("\n");
            send(ex, 200, sb.toString());
        });

        // CONTROL PLANE: the operator's levers — brown out the dep, and roll the version back.
        server.createContext("/admin", ex -> {
            String q = ex.getRequestURI().getQuery();          // dep=fail|ok  version=v1|v2
            if (q != null) for (String kv : q.split("&")) {
                String[] p = kv.split("=", 2); if (p.length < 2) continue;
                if (p[0].equals("dep")) depFailing.set(p[1].equals("fail"));
                if (p[0].equals("version")) version = p[1];
                // reset the measurement window: the single-process analog of scoping a
                // dashboard to the incident window, so each phase's numbers stand alone.
                if (p[0].equals("reset")) { reqTotal.set(0); errTotal.set(0);
                                            synchronized (ringLock) { ringIdx = 0; } }
            }
            send(ex, 200, "version=" + version + " depFailing=" + depFailing.get());
        });

        System.out.println("OpService up on :" + port + " version=" + version);
        server.start();
    }

    static void log(String reqId, String path, int status, long ms) {
        System.out.println(String.format(
            "{\"ts\":%d,\"level\":\"info\",\"req_id\":\"%s\",\"path\":\"%s\",\"status\":%d,\"latency_ms\":%d,\"version\":\"%s\"}",
            System.currentTimeMillis(), reqId, path, status, ms, version));
    }
    static String firstNonNull(String a, String b) { return a != null ? a : b; }
    static void send(HttpExchange ex, int status, String body) throws java.io.IOException {
        byte[] b = body.getBytes(StandardCharsets.UTF_8);
        ex.sendResponseHeaders(status, b.length);
        try (OutputStream os = ex.getResponseBody()) { os.write(b); }
    }
}
Build it (2) — the same service in Go
Single file. APP_VERSION=v2 go run opservice.go. Same four operability properties, idiomatic net/http.
package main

import (
	"encoding/json"
	"fmt"
	"log"
	"math"
	"net/http"
	"os"
	"sort"
	"sync"
	"sync/atomic"
	"time"
)

const (
	ringSize   = 4096
	depTimeout = 100 * time.Millisecond
)

var (
	reqTotal atomic.Int64
	errTotal atomic.Int64

	ringMu sync.Mutex
	ring   [ringSize]float64
	ringN  int

	depFailing atomic.Bool
	version    atomic.Value // string: "v1" resilient, "v2" the bad deploy
)

func recordLatency(ms float64) {
	ringMu.Lock()
	ring[ringN%ringSize] = ms
	ringN++
	ringMu.Unlock()
}

func percentile(p float64) float64 {
	ringMu.Lock()
	n := ringN
	if n > ringSize {
		n = ringSize
	}
	snap := make([]float64, n)
	copy(snap, ring[:n])
	ringMu.Unlock()
	if n == 0 {
		return 0
	}
	sort.Float64s(snap)
	idx := int(math.Ceil(p/100*float64(n))) - 1
	if idx < 0 {
		idx = 0
	}
	if idx >= n {
		idx = n - 1
	}
	return snap[idx]
}

// downstream dependency: browns out (slow, then 5xx) when failing.
func callDependency() error {
	if depFailing.Load() {
		time.Sleep(800 * time.Millisecond)
		return fmt.Errorf("dependency 5xx")
	}
	time.Sleep(10 * time.Millisecond)
	return nil
}

// v1 path: bounded wait + fail-open fallback.
func callWithTimeout(d time.Duration) error {
	done := make(chan error, 1)
	go func() { done <- callDependency() }()
	select {
	case err := <-done:
		return err
	case <-time.After(d):
		return fmt.Errorf("timeout")
	}
}

func apiHandler(w http.ResponseWriter, r *http.Request) {
	reqID := r.Header.Get("X-Request-Id")
	if reqID == "" {
		reqID = fmt.Sprintf("%d", time.Now().UnixNano())
	}
	start := time.Now()
	reqTotal.Add(1)
	ver := version.Load().(string)

	var status int
	var body string
	if ver == "v1" { // resilient: timeout + fallback, never surfaces dep error
		if err := callWithTimeout(depTimeout); err != nil {
			status, body = 200, `{"result":"fallback"}`
		} else {
			status, body = 200, `{"result":"ok"}`
		}
	} else { // v2: the regression — no timeout, fail-closed
		if err := callDependency(); err != nil {
			errTotal.Add(1)
			status, body = 500, `{"error":"dependency unavailable"}`
		} else {
			status, body = 200, `{"result":"ok"}`
		}
	}
	ms := float64(time.Since(start).Milliseconds())
	recordLatency(ms)
	logLine(reqID, "/api", status, ms, ver)
	w.WriteHeader(status)
	fmt.Fprint(w, body)
}

func main() {
	version.Store(getenv("APP_VERSION", "v1"))
	port := getenv("PORT", "8080")

	http.HandleFunc("/api", apiHandler)

	// LIVENESS: no downstream check — a dep outage must never restart us.
	http.HandleFunc("/healthz", func(w http.ResponseWriter, r *http.Request) {
		fmt.Fprint(w, "OK")
	})

	// READINESS: can I serve now? v1 can (fallback); v2 cannot while dep is down.
	http.HandleFunc("/readyz", func(w http.ResponseWriter, r *http.Request) {
		ready := !depFailing.Load() || version.Load().(string) == "v1"
		if !ready {
			w.WriteHeader(http.StatusServiceUnavailable)
			fmt.Fprint(w, "NOT_READY")
			return
		}
		fmt.Fprint(w, "READY")
	})

	// METRICS: Prometheus-style scrape.
	http.HandleFunc("/metrics", func(w http.ResponseWriter, r *http.Request) {
		total, err := reqTotal.Load(), errTotal.Load()
		rate := 0.0
		if total > 0 {
			rate = 100 * float64(err) / float64(total)
		}
		fmt.Fprintf(w, "# TYPE http_requests_total counter\nhttp_requests_total %d\n", total)
		fmt.Fprintf(w, "# TYPE http_errors_total counter\nhttp_errors_total %d\n", err)
		fmt.Fprint(w, "# TYPE http_request_latency_ms summary\n")
		fmt.Fprintf(w, "http_request_latency_ms{quantile=\"0.5\"} %.0f\n", percentile(50))
		fmt.Fprintf(w, "http_request_latency_ms{quantile=\"0.99\"} %.0f\n", percentile(99))
		fmt.Fprintf(w, "http_error_rate_percent %.2f\n", rate)
	})

	// CONTROL PLANE: brown out the dep, and roll the version back.
	http.HandleFunc("/admin", func(w http.ResponseWriter, r *http.Request) {
		if v := r.URL.Query().Get("dep"); v != "" {
			depFailing.Store(v == "fail")
		}
		if v := r.URL.Query().Get("version"); v != "" {
			version.Store(v)
		}
		if r.URL.Query().Get("reset") != "" { // scope a fresh measurement window
			reqTotal.Store(0)
			errTotal.Store(0)
			ringMu.Lock()
			ringN = 0
			ringMu.Unlock()
		}
		fmt.Fprintf(w, "version=%s depFailing=%v", version.Load(), depFailing.Load())
	})

	log.Printf("OpService up on :%s version=%s", port, version.Load())
	log.Fatal(http.ListenAndServe(":"+port, nil))
}

func getenv(k, d string) string {
	if v := os.Getenv(k); v != "" {
		return v
	}
	return d
}

func logLine(reqID, path string, status int, ms float64, ver string) {
	rec := map[string]any{
		"ts": time.Now().UnixMilli(), "level": "info", "req_id": reqID,
		"path": path, "status": status, "latency_ms": ms, "version": ver,
	}
	b, _ := json.Marshal(rec)
	log.Println(string(b))
}
Break it by running it — inject the failure, drive load, read the signal
Start on the bad deploy, then drive steady load in one shell while you operate in another. Portable, only curl needed:
# terminal A — run the bad deploy
APP_VERSION=v2 java OpService        # or: APP_VERSION=v2 go run opservice.go

# terminal B. reset=1 scopes a fresh measurement window — the single-process analog
# of selecting the incident time-range on a dashboard (real counters are monotonic;
# you'd apply rate()/a time window at query time instead of resetting).
curl -s "localhost:8080/admin?reset=1" >/dev/null

# drive load: 400 requests, 25 concurrent, tally status codes
seq 1 400 | xargs -P 25 -I{} curl -s -o /dev/null -w "%{http_code}\n" \
  localhost:8080/api | sort | uniq -c
#     400 200

# steady state — scrape the signals
curl -s localhost:8080/metrics
#   http_requests_total 400
#   http_errors_total 0
#   http_request_latency_ms{quantile="0.5"} 10
#   http_request_latency_ms{quantile="0.99"} 12
#   http_error_rate_percent 0.00
curl -s -o /dev/null -w "readyz=%{http_code}\n" localhost:8080/readyz   # readyz=200
Now inject the dependency failover — one operator action — and drive the same load into a fresh window:
curl -s "localhost:8080/admin?dep=fail&reset=1"   # downstream browns out (slow + 5xx)
seq 1 400 | xargs -P 25 -I{} curl -s -o /dev/null -w "%{http_code}\n" \
  localhost:8080/api | sort | uniq -c
#     400 500                          —  every request now fails

curl -s localhost:8080/metrics
#   http_errors_total 400
#   http_request_latency_ms{quantile="0.99"} 805   —  p99 blew up: the 800ms brownout
#   http_error_rate_percent 100.00
curl -s -o /dev/null -w "readyz=%{http_code}\n" localhost:8080/readyz   # readyz=503
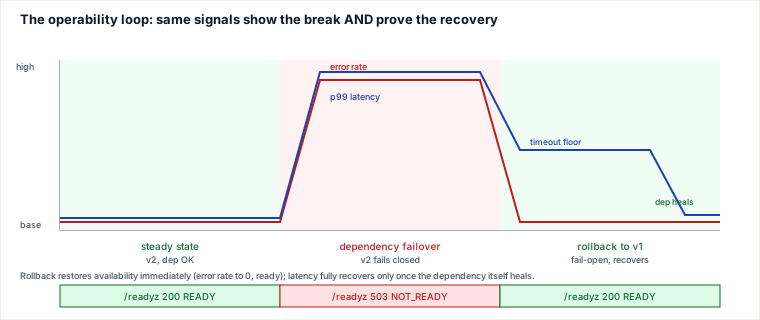
What the operator sees — from signals alone, without reading the code: error rate went 0% → 100%, p99 went ~12ms → ~805ms, and /readyz flipped 200 → 503 while /healthz stayed 200. That last pair is the diagnosis: the process is fine (liveness green) but it can't serve (readiness red) — so this is a downstream/dependency problem, not a crashed process. Grepping the structured logs confirms it and dates it: grep '"status":500' | grep '"version":"v2"' shows the 500s all carry version:v2 and started at the failover. You now know what broke and which change to reverse without ever opening the source.
Roll back — and verify recovery with the same metrics
The dependency is still down — you don't control it. But you control your code. Roll the version flag back to the resilient v1, which has the timeout + fail-open fallback, and re-measure:
curl -s "localhost:8080/admin?version=v1&reset=1"   # ROLL BACK to known-good
seq 1 400 | xargs -P 25 -I{} curl -s -o /dev/null -w "%{http_code}\n" \
  localhost:8080/api | sort | uniq -c
#     400 200                          —  success restored, dep still down

curl -s localhost:8080/metrics
#   http_error_rate_percent 0.00       —  errors gone
#   http_request_latency_ms{quantile="0.99"} 101  —  capped at the 100ms timeout, not 805ms
curl -s -o /dev/null -w "readyz=%{http_code}\n" localhost:8080/readyz   # readyz=200
Rollback restored availability instantly (errors → 0, readyz → 200) even though the dependency is still broken — because v1 fails open with a fast timeout. Latency is still elevated (~100ms, the timeout floor) because every request waits out the timeout before falling back. Full recovery comes only when the dependency itself heals:
curl -s "localhost:8080/admin?dep=ok&reset=1"     # dependency finishes failing over
seq 1 400 | xargs -P 25 -I{} curl -s -o /dev/null -w "%{http_code}\n" localhost:8080/api >/dev/null
curl -s localhost:8080/metrics
#   http_request_latency_ms{quantile="0.99"} 12   —  fully recovered
This two-phase recovery is the real lesson: you reverse what you own (the deploy) to stop the bleeding, and the thing you don't own (the dependency) recovers on its own timeline. A rollback that depended on the dependency being healthy would be no rollback at all.
Measure — before / after (a representative run)
Recompute these on your own machine; the shape is what matters, not the exact milliseconds.
| Phase | version | dependency | error rate | p99 | /readyz | /healthz |
|---|---|---|---|---|---|---|
| Steady state | v2 | OK | 0.00% | ~12 ms | 200 | 200 |
| Dependency failover | v2 | failing | 100.00% | ~805 ms | 503 | 200 |
| After rollback | v1 | failing | 0.00% | ~101 ms | 200 | 200 |
| After dep heals | v1 | OK | 0.00% | ~12 ms | 200 | 200 |
The two numbers that decided the incident: error rate (100% → 0%) and p99 (805ms → 101ms), both reversed by the single rollback action. /healthz never moved — correctly, because the process was never wedged.
Defend under pushback
"Why did v1 show zero errors when the dependency was 100% down — isn't that hiding a problem?" It's failing open: on timeout it serves a safe degraded fallback and counts a success, because for this endpoint a slightly-stale/fallback response beats an error. The problem isn't hidden — p99 still rose and you'd have a separate "dependency_unavailable" counter and log line firing. Fail-open trades freshness/completeness for availability. It's right for non-critical reads (recommendations, avatars, related-items). It is wrong for anything where a wrong "success" is dangerous — auth ("you're allowed in"), payments ("charge succeeded"), inventory decrement. Those must fail closed: reject and surface the error rather than fabricate a result. The v1/v2 split in this lab is that decision; a staff engineer makes it per-endpoint, deliberately, before the incident.
"What do you actually alert on — the dependency's 500s?" No. Alert on the symptom the user feels (SLO violation), not the cause. Paging on "dependency returned 5xx" is noisy and often wrong — on v1 that dependency was 100% down and no user was harmed, so a cause-based page would have woken someone for nothing. The right signal is error-budget burn rate (Google SRE): if your SLO is 99.9% and you're burning budget fast enough to exhaust a month's allowance in an hour, page now; if you're burning slowly, open a ticket. A multi-window burn-rate alert (fast-burn pages, slow-burn tickets) catches real user pain and stays quiet when a fallback absorbed the fault. Cause metrics (the dependency's 5xx) belong on a dashboard for diagnosis, not on a pager.
"Why not just put the dependency check in /healthz and let Kubernetes restart the pod?" Because liveness failure means "restart me," and restarting cannot fix a downstream outage — it just removes capacity. If /healthz depended on the dependency, a 30-second dep blip would make the orchestrator kill every pod simultaneously, and they'd all fail their post-restart liveness check too: a self-inflicted total outage on top of a partial one. Liveness must test only the process's own health (event loop responsive, not deadlocked). Readiness is where the downstream check belongs — failing /readyz makes the load balancer stop sending traffic (shed), which is safe and reversible, without destroying the instance. Readiness ≠ liveness is exactly the "shed vs restart" distinction.
"Blue-green, canary, or rollback — aren't these the same thing?" No, they answer different questions. Canary is about limiting blast radius on the way out: shift 1% → 5% → 25% of traffic to the new version, watch its SLIs against the old, and abort if they diverge — had v2 been canaried, the failover would have burned 1% of traffic, not 100%, and auto-aborted. Blue-green is about making reversal instant: run two full environments and flip the router; rollback is a second flip, no rebuild. Rollback is the escape hatch itself: return to the last known-good. They compose: canary to catch it early, blue-green (or a flag) to reverse it in seconds, rollback as the action you take. A missing timeout regression like v2's is precisely the class of bug a canary catches before it's everyone's problem.
Trade-off / selection — rollback vs roll-forward vs feature-flag kill-switch
When the graph is red, your first decision is how to reverse. Three tools, chosen by what the bad change touched:
| Reversal | What it is | Speed | Choose when | Blocked when |
|---|---|---|---|---|
| Feature-flag kill-switch | Toggle the risky code path off at runtime, no deploy (this lab's ?version=v1) | Seconds | The change was shipped behind a flag and the "off" path is the tested known-good. Fastest, per-cohort, no rebuild. | You didn't wrap it in a flag in advance, or the off-path was never exercised. |
| Rollback | Redeploy the previous known-good build | Minutes (seconds with blue-green) | The bad change is the deploy itself and the previous version is safe to run right now. Default reflex. | The deploy ran an irreversible forward migration, or new data was written in a format the old code can't read. |
| Roll-forward | Write, test, and deploy a fix | Tens of minutes+ | Rollback is unsafe (schema/data moved on) or the bug predates this deploy so there's no good version to return to. | Under active user pain — you're burning budget while you code; mitigate first (shed/flag) then roll forward. |
Selection rule: if it's behind a flag, flip the flag (fastest, safest); else if the deploy is cleanly reversible, roll back; else roll forward — but always mitigate first (shed load, fail open, kill the feature) so you're not writing code against a running error-budget fire. The worst answer is "let me debug the root cause in prod" while users bleed.
Acceptance criteria — verify you hit it
/metricsexposes, andcurlconfirms: request count, error count, p50, p99, and a derived error-rate percent./healthzstays 200 throughout the dependency brownout — liveness does not depend on any downstream./readyzflips to 503 on the version that can't serve (v2, dep down) and stays 200 on the one that can (v1) — you can articulate why.- Every request emits one structured JSON log line carrying
req_id,status,latency_ms, andversion; you used it to date the errors to the v2 deploy. - You injected the dependency failure, drove load, and identified the break from signals alone (error% ↑, p99 ↑, readyz flip, healthz steady) — not by reading source.
- You executed a rollback via the version lever and confirmed recovery on the same metrics (error% → 0, readyz → 200), then full p99 recovery once the dependency healed.
- You can state, for this endpoint, whether it should fail-open or fail-closed, and give the reason.
- You can name what you'd page on (SLO burn rate — the symptom) vs what you'd only dashboard/log (the dependency's raw 5xx — the cause).
- You can distinguish, in one sentence each, canary (limit blast radius), blue-green (instant reversal), and rollback (the reversal action).
What you've mastered when this is done
- Instrumenting a service so an operator can diagnose it from the outside — scrapeable metrics with real percentiles, split liveness/readiness health, and structured request-id logs.
- Running the incident loop for real: observe the signal → localize (dep vs process) → reverse the change you own → verify recovery on the same signal.
- The single most common reliability regression — a missing timeout + fallback — and why fail-open vs fail-closed is a per-endpoint decision made before the incident.
- Alerting on symptom (SLO burn rate) not cause, why readiness ≠ liveness prevents restart storms, and when to reach for a flag vs rollback vs roll-forward.
Related: Metrics, Logs & Traces — the Three Pillars · Back-Pressure — block, drop, or shed · Build a Metrics Pipeline.
Sources
Betsy Beyer, Chris Jones, Jennifer Petoff & Niall Richard Murphy (eds.), Site Reliability Engineering: How Google Runs Production Systems (O'Reilly, 2016) — chapters on Service Level Objectives (SLIs/SLOs/error budgets) and "Practical Alerting" / alerting on SLOs. Betsy Beyer et al., The Site Reliability Workbook (O'Reilly, 2018) — "Alerting on SLOs" (multi-window burn-rate alerts). Michael T. Nygard, Release It! Design and Deploy Production-Ready Software, 2nd ed. (Pragmatic Bookshelf, 2018) — the Stability patterns: Timeouts, Circuit Breaker, Bulkhead, Fail Fast, and the missing-timeout cascading-failure case.
🎯 STRICT STANDOUT — Operability Capstone (Hands-On H1)
Why this lab: A service that can’t be instrumented, broken on purpose, and rolled back is not shippable. This capstone ties SLIs → dashboards → failure injection → rollback proof.
1. Runnable contract (K11)
- Define SLIs (e.g. success rate, p99 latency) before coding dashboards.
- Service exports metrics; load generator + fault inject (kill, latency, error rate).
- Rollback procedure returns SLIs to baseline — measured, not asserted.
Hand-run: Baseline error rate <0.1%; inject 50% errors → SLI red; rollback/fix → SLI green within RTO target you named.
2. Failure modes (K12)
- Metrics that don’t match user pain (CPU high, users fine) → wrong SLI.
- Deploy without rollback path → extended outage.
- Alert fatigue from noisy signals → pages ignored.
3. When-NOT (K13)
- Prototype day-1 → log stdout OK; still name what you’d add before prod.
- Don’t build a full observability platform in-app — emit metrics, use a backend.
4. Hostile panel
- SLI vs SLO vs SLA? — measure / target / contract.
- Why error budget? — release velocity vs reliability trade-off.
- How do you know rollback worked? — same SLI query, before/after windows.
5. Drills
Add one RED metric suite; break dependency; document runbook steps with timing.
🔩 Production depth — Operability Capstone
Spine: durability · private lab · not a tool list
Production angle
Correctness without operability is luck. For money and durable pipelines, if you cannot see failure, inject it, and prove rollback, you do not control the system — you host it.
Worked failure: green dashboards, red money
- Dashboards show CPU and request rate healthy.
- Ledger posts stall; payments return 200 from a cache of “pending.”
- No SLI on
postings_per_minuteor recon lag → hours of silent drift.
Fix shape: SLIs that match user/money truth; synthetic checks; recon lag alert; rollback procedure that re-queries the same SLIs.
Invariants
- Every critical path has an SLI and an owner.
- Game day: inject fail → SLI red → rollback/fix → SLI green with timestamped proof.
- Runbooks exist before SEV-1, not in the incident channel after.
When-NOT
Prototype day-one: logs to stdout OK — but list what you add before real money. Do not build a full observability SaaS inside the app; emit metrics and use a backend.
Related: Every money/durability lab should name its SLI.
🤖 Don't fully get this? Learn it with Claude
Stuck on Build an Operability Capstone — Instrument, Deploy, Break & Roll Back? Open Claude, copy a block below, and it'll teach you this exact concept — visually and interactively.
Build the mental picture, not memorization.
I just read a lesson on **Build an Operability Capstone — Instrument, Deploy, Break & Roll Back** (Hands-On Builds) and want to truly understand it. Explain Build an Operability Capstone — Instrument, Deploy, Break & Roll Back from first principles using ONE vivid real-world analogy and a visual mental model — draw it as ASCII art or a clear step-by-step diagram — with a concrete example using real numbers. Then ask me one question to check I got the mental picture, and wait for my reply. If you're unsure or a claim isn't standard, say so and reason from first principles instead of guessing.
Socratic — adapts to where you're stuck.
Teach me **Build an Operability Capstone — Instrument, Deploy, Break & Roll Back** interactively. Ask me ONE guiding question at a time, wait for my answer, and adapt to my confusion — build the idea with me step by step instead of explaining it all at once. If you're unsure or a claim isn't standard, say so and reason from first principles instead of guessing.
Active recall exposes what you missed.
Quiz me on **Build an Operability Capstone — Instrument, Deploy, Break & Roll Back** with 5 questions, easy to tricky, ONE at a time. Tell me if each answer is right; at the end, explain clearly what I got wrong and why. If you're unsure or a claim isn't standard, say so and reason from first principles instead of guessing.
Intuition + hook + flashcards for long-term memory.
Help me remember **Build an Operability Capstone — Instrument, Deploy, Break & Roll Back** for the long term: give the one-sentence intuition, a memorable hook/mnemonic, a tiny worked example, and 3 active-recall flashcards (Q -> A). If you're unsure or a claim isn't standard, say so and reason from first principles instead of guessing.