Cache Performance Metrics
A cache pays off only when the time it saves on hits outweighs the time it wastes on misses, and the one number that captures that balance is Average Memory Access Time (AMAT) — the hit and miss latencies weighted by how often each actually happens. Hit rate, miss rate, cache size and latency are the raw inputs; AMAT is the number you reason with when you decide whether the cache is worth keeping.
The four raw metrics — and why each alone lies to you
- Hit rate — fraction of lookups served from the cache. High is good, but a high hit rate on cheap-to-recompute data buys you nothing.
- Miss rate = 1 − hit rate. What matters is not that misses exist but what each one costs.
- Cache size — bounds how much of the working set fits. Its effect on hit rate is non-linear: below the working set you thrash; above it, extra memory is wasted spend.
- Cache latency (thit) — time to serve a hit. For a remote cache this is a network hop (~1 ms), and crucially you pay it on misses too, because you check the cache before falling through.
None of these tells you whether the cache helps. AMAT combines them:
AMAT = t_hit + miss_rate × miss_penalty

     where miss_penalty = extra time to fetch from the source
     (equivalently: AMAT = hit_rate×t_hit + miss_rate×(t_hit + source_time))
You compare AMAT against the no-cache baseline (just hit the source every time). If AMAT is lower, the cache is earning its keep; the ratio baseline / AMAT is your speedup.
Worked example: Redis in front of Postgres
Measured values for one endpoint: a Redis hit takes thit = 1 ms; a Postgres fetch on a miss takes an extra miss_penalty = 50 ms. Without any cache, every request pays the 50 ms DB read (baseline).
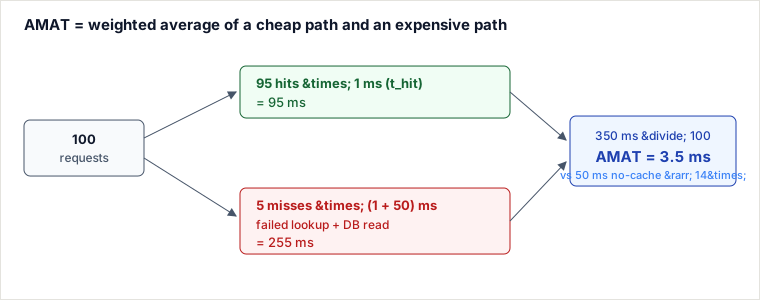
Trace 100 requests at a 95% hit rate:
- 95 requests hit Redis: 95 × 1 ms = 95 ms.
- 5 requests miss: each pays the 1 ms failed lookup plus the 50 ms DB read = 51 ms, so 5 × 51 = 255 ms.
- Total = 350 ms over 100 requests → AMAT = 3.5 ms.
- Baseline is 50 ms → speedup = 50 / 3.5 ≈ 14×.
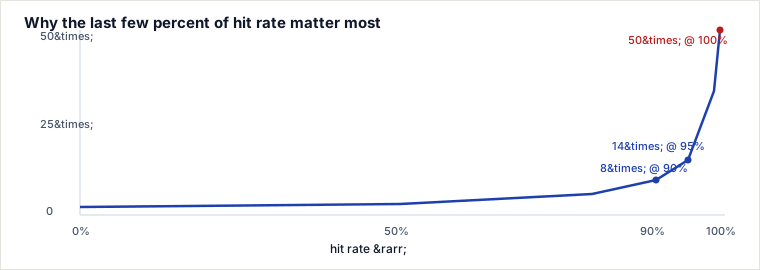
Now sweep the hit rate and watch what happens:
| Hit rate | AMAT = 1 + (1−h)×50 | Speedup vs 50 ms baseline |
|---|---|---|
| 50% | 26.0 ms | 1.9× |
| 80% | 11.0 ms | 4.5× |
| 90% | 6.0 ms | 8.3× |
| 95% | 3.5 ms | 14× |
| 99% | 1.5 ms | 33× |
| 99.9% | 1.05 ms | 48× |
The lesson hiding in the table: because the miss is ~50× costlier than a hit, the last few percent of hit rate carry most of the value. Going 90% → 99% nearly quadruples the speedup (8× → 33×), while 50% → 80% barely moves it. That is why engineers obsess over squeezing 92% up to 98%.
When to use it / when NOT to
AMAT is a throughput / average-latency instrument. Reach for it when you are sizing a cache, comparing designs, or justifying its cost: it tells you the mean cost per request and the break-even point. The break-even hit rate is where AMAT equals the baseline: miss_rate × miss_penalty = source_time − t_hit. When thit ≪ source_time (Redis 1 ms vs DB 50 ms), break-even is a ~2% hit rate — the cache almost always wins. But if you are caching something cheap — a 2 ms computation behind a 1 ms remote cache — break-even jumps to a 50% hit rate, and below that the cache is pure overhead. That single calculation is the difference between a senior engineer adding a cache and adding a liability.
Choose AMAT when the SLO is about average latency or aggregate DB load. Prefer p99 / tail latency when the SLO is about the worst request: a 95% hit rate means 1 in 20 users still eats the full 51 ms, so your p95 is a cache miss no matter how good the average looks — AMAT structurally hides this. And prefer measuring origin QPS reduction when the real goal is protecting a fragile backend from load rather than shaving user latency; there, a modest hit rate that caps DB queries can matter more than AMAT. Use all three together: AMAT for the money, p99 for the user, origin QPS for the backend.
Pitfalls
- The average hides the tail. AMAT of 3.5 ms looks great, but every miss is a 51 ms user experience. If you page on p99 and never miss-instrument, a hit-rate dip from 99% to 95% barely moves AMAT yet doubles the fraction of users seeing slow requests.
- The cache tax on misses. A miss costs thit + source, not just source. If you cache cheap data with a low hit rate, AMAT can exceed the baseline — the cache makes the system slower. Always compute break-even before shipping.
- Gamed hit rate. Counting hits on data nobody re-reads, or on near-static junk, inflates the number without cutting real cost. Weight by cost, not by count.
- Stale hits counted as good. A hit that returns wrong data is a correctness bug, not a win; hit rate says nothing about freshness.
- Warm-up and window skew. Measuring right after a deploy or flush shows a cold-cache miss storm; measure over a steady-state window, and watch hit rate during traffic shifts.
- Working set > cache size. Hit rate does not degrade gracefully — cross the working-set boundary and it collapses as the cache thrashes (capacity misses). Size against the working set, not a round number of GB.
Takeaways
- AMAT = thit + miss_rate × miss_penalty is the one metric that tells you if a cache is worth it; compare it to the no-cache baseline.
- Because misses are far costlier than hits, value is concentrated in the top few percent of hit rate — 90%→99% matters far more than 50%→80%.
- You pay thit on misses too, so caching cheap data at a low hit rate can be net-negative; check the break-even hit rate first.
- AMAT is an average — pair it with p99 (the user's miss) and origin QPS reduction (backend protection) to see the whole picture.
Re-authored and deepened for this guide. AMAT and the miss-penalty framing follow Hennessy & Patterson, Computer Architecture: A Quantitative Approach. Hit/miss instrumentation reflects real cache telemetry (Redis INFO stats keyspace_hits / keyspace_misses) and the operational lessons in Nishtala et al., “Scaling Memcache at Facebook” (USENIX NSDI 2013). Latency figures are representative order-of-magnitude values for a remote cache in front of a relational database.
🤖 Don't fully get this? Learn it with Claude
Stuck on Cache Performance Metrics? Open Claude, copy a block below, and it'll teach you this exact concept — visually and interactively.
Build the mental picture, not memorization.
I just read a lesson on **Cache Performance Metrics** (System Design) and want to truly understand it. Explain Cache Performance Metrics from first principles using ONE vivid real-world analogy and a visual mental model — draw it as ASCII art or a clear step-by-step diagram — with a concrete example using real numbers. Then ask me one question to check I got the mental picture, and wait for my reply. If you're unsure or a claim isn't standard, say so and reason from first principles instead of guessing.
Socratic — adapts to where you're stuck.
Teach me **Cache Performance Metrics** interactively. Ask me ONE guiding question at a time, wait for my answer, and adapt to my confusion — build the idea with me step by step instead of explaining it all at once. If you're unsure or a claim isn't standard, say so and reason from first principles instead of guessing.
Active recall exposes what you missed.
Quiz me on **Cache Performance Metrics** with 5 questions, easy to tricky, ONE at a time. Tell me if each answer is right; at the end, explain clearly what I got wrong and why. If you're unsure or a claim isn't standard, say so and reason from first principles instead of guessing.
Intuition + hook + flashcards for long-term memory.
Help me remember **Cache Performance Metrics** for the long term: give the one-sentence intuition, a memorable hook/mnemonic, a tiny worked example, and 3 active-recall flashcards (Q -> A). If you're unsure or a claim isn't standard, say so and reason from first principles instead of guessing.