Activity Diagrams
An activity diagram models a behavior as a directed graph of actions connected by control-flow edges, where decision nodes branch the token down exactly one guarded path and fork/join bars split the token into parallel flows that must all rejoin before the flow continues — so reading it is literally tracing a single token from the start node to the end node.
The mental model is a token (think of a board-game piece) that enters at the solid start dot, sits on one action at a time, and moves along an arrow only when that action completes. At a diamond it follows the one outgoing arrow whose guard [condition] is true; at a fork bar it clones into one token per outgoing arrow; at a join bar the clones are absorbed back into one. The flow ends when the token reaches the bullseye final node. This token-flow rule is what makes an activity diagram precise rather than a vague flowchart.
Worked example: online checkout, traced step by step
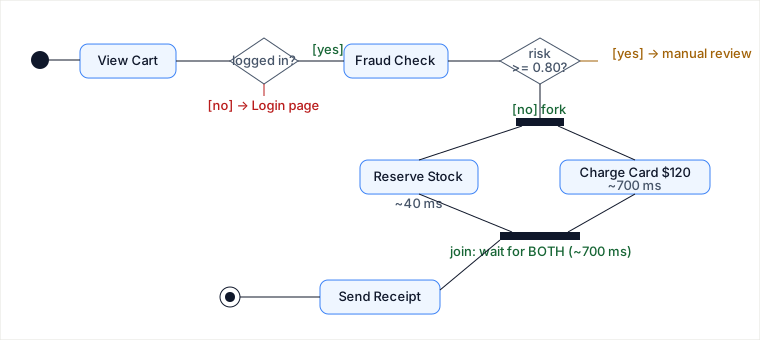
Take a real cart: 2 items, subtotal $120, the user has a saved card, and we run a fraud check that returns a riskScore of 0.18 (threshold for manual review is 0.80). The diagram below has a decision (logged in?), a fork (reserve stock and charge card run in parallel), and a join. Here is the token walk for these exact inputs:
| Step | Node (type) | What happens with our values | Token after |
|---|---|---|---|
| 1 | Start (initial) | Token created when user clicks "Checkout" | 1 token → View Cart |
| 2 | View Cart (action) | Render 2 items, subtotal $120 | 1 token → decision |
| 3 | Logged in? (decision) | User is logged in → guard [yes] true, [no] skipped | 1 token → Fraud Check |
| 4 | Fraud Check (action) | riskScore = 0.18, which is < 0.80 | 1 token → decision |
| 5 | Risk ≥ 0.80? (decision) | [no] branch taken (0.18 < 0.80); manual-review branch not entered | 1 token → fork |
| 6 | Fork (fork bar) | Token splits into 2 parallel flows | 2 tokens (A: Reserve Stock, B: Charge $120) |
| 7a | Reserve Stock (action) | Decrement inventory for both SKUs; takes ~40 ms | token A → join |
| 7b | Charge Card (action) | Capture $120 on saved card; takes ~700 ms | token B → join |
| 8 | Join (join bar) | Waits for BOTH A and B; fires at max(40, 700) = ~700 ms | 1 token → Send Receipt |
| 9 | Send Receipt (action) | Email order confirmation | 1 token → Final |
| 10 | Final (bullseye) | Flow complete; order placed | 0 tokens |
Notice step 8: the join is a synchronization point. Even though stock reservation finished in 40 ms, the token cannot leave the join until the 700 ms card charge also arrives. That "wait for the slowest parallel branch" behavior is the whole reason to draw a fork/join instead of two sequential actions — and it is exactly what a plain text spec tends to hide.
Activity vs. sequence diagram
Both are dynamic (behavioral) UML diagrams, but they answer different questions, so they are not interchangeable.
| Activity diagram | Sequence diagram | |
|---|---|---|
| Primary axis | Flow of control / order of steps | Time + which object sends which message |
| Best at showing | Branches, loops, parallelism (fork/join) | Object collaboration, request/response ordering |
| Hides | Which object owns each action | Conditional branching beyond simple alt/opt fragments |
| Use when | Modeling a workflow / business process / use-case path | Designing how objects call each other to realize one scenario |
In our checkout: the activity diagram above makes the parallel reserve-vs-charge fork obvious; a sequence diagram would instead show CheckoutController calling InventoryService.reserve() and PaymentGateway.charge() — clearer on who calls whom, but it buries the join's "wait for both" semantics in lifeline timing.
Pitfalls
- Non-exhaustive or overlapping decision guards. If a diamond's outgoing guards do not cover every case (e.g. only
[risk > 0.80]and[risk < 0.80], with nothing for exactly0.80), the token has nowhere to go and the flow stalls. Guards on one decision must be mutually exclusive and collectively exhaustive — add an explicit[else]. - Forgetting the join, leaving a fork dangling. A fork without a matching join means the parallel tokens never re-synchronize, so a downstream action like "Send Receipt" can fire after only the fast branch finished — you email a receipt before the card actually charged. Every fork needs its join.
- Treating a decision diamond like a fork. A decision sends the token down one branch; a fork sends it down all. Drawing two arrows out of a diamond with no guards looks like parallelism but is actually an undefined (effectively random) choice.
- Confusing it with a flowchart and putting object internals in it. Activity diagrams model the process, not the call stack. Cramming "return null", loop counters, and exception stack traces into actions turns it into pseudo-code and loses the workflow-level clarity that justified drawing it.
- Unbounded loops with no exit guard. A "retry payment" edge that loops back without a max-attempts guard models an infinite retry. Real systems need the bound on the diagram so the failure path is visible.
When to reach for an activity diagram (and when not)
Decision criteria — pick an activity diagram when these signals appear: the behavior has multiple branches or loops; there is genuine concurrency you must show synchronizing (fork/join); the audience includes non-developers (PMs, analysts) who care about the process, not the classes; or you are documenting the happy-path-plus-alternatives of a single use case.
Trade-offs vs. named alternatives
- vs. Sequence diagram: You gain a clean view of branching and parallelism; you lose the explicit object-to-object message ordering. Choose the activity diagram when the question is "in what order do the steps run, and which run in parallel?"; prefer the sequence diagram when the question is "which object calls which method, and in what order, to realize this scenario?"
- vs. State machine diagram: Activity diagrams are about what gets done (action-centric); state machines are about what condition the entity is in and which events transition it (state-centric). You gain step-by-step procedural clarity but lose a precise account of an object's lifecycle. Choose activity when modeling a procedure with a clear start and end; prefer a state machine when one long-lived object (e.g. an
Order: Pending → Paid → Shipped → Delivered) reacts to events over its lifetime. - vs. a plain flowchart: You gain UML-precise semantics — fork/join concurrency, swimlanes for responsibility, object flow — at the cost of more notation to learn and maintain. A flowchart is fine for a linear if/else script; once you need to show two things happening at once, the flowchart cannot express the synchronization and the activity diagram earns its keep.
Concrete call: for our checkout, because reserve-stock and charge-card truly run concurrently and must both finish before the receipt, the activity diagram is the right tool — a sequence diagram would obscure the join, and a state machine would force us to invent states for a one-shot procedure that does not really have a lifecycle.
Takeaways
- Read an activity diagram by tracing a single token: actions hold it, decisions route it down one guarded path, forks clone it, joins wait for all clones and merge them.
- Fork/join is the feature that distinguishes it from a flowchart — the join's "wait for the slowest branch" semantics is the reason to draw concurrency instead of describing it.
- Guards on a decision must be mutually exclusive and exhaustive, and every fork needs its join; both are the most common ways a diagram silently goes wrong.
- Choose it for branching/parallel workflows; reach for a sequence diagram for object collaboration and a state machine for an entity's lifecycle.
Sources: UML 2.5.1 specification (OMG), §15–16 on activities, control nodes, and fork/join semantics; Martin Fowler, UML Distilled (3rd ed.), chapter on Activity Diagrams; "Grokking the Object Oriented Design Interview" (DesignGurus) for the online-shopping example. Re-authored and deepened for this guide: replaced the placeholder alt='Image' figure with a hand-authored SVG and a step-by-step token trace using concrete values, and added pitfalls plus a selection/trade-offs section contrasting activity vs. sequence, state machine, and flowchart.
🤖 Don't fully get this? Learn it with Claude
Stuck on Activity Diagrams? Open Claude, copy a block below, and it'll teach you this exact concept — visually and interactively.
Build the mental picture, not memorization.
I just read a lesson on **Activity Diagrams** (OO & Low-Level Design) and want to truly understand it. Explain Activity Diagrams from first principles using ONE vivid real-world analogy and a visual mental model — draw it as ASCII art or a clear step-by-step diagram — with a concrete example using real numbers. Then ask me one question to check I got the mental picture, and wait for my reply. If you're unsure or a claim isn't standard, say so and reason from first principles instead of guessing.
Socratic — adapts to where you're stuck.
Teach me **Activity Diagrams** interactively. Ask me ONE guiding question at a time, wait for my answer, and adapt to my confusion — build the idea with me step by step instead of explaining it all at once. If you're unsure or a claim isn't standard, say so and reason from first principles instead of guessing.
Active recall exposes what you missed.
Quiz me on **Activity Diagrams** with 5 questions, easy to tricky, ONE at a time. Tell me if each answer is right; at the end, explain clearly what I got wrong and why. If you're unsure or a claim isn't standard, say so and reason from first principles instead of guessing.
Intuition + hook + flashcards for long-term memory.
Help me remember **Activity Diagrams** for the long term: give the one-sentence intuition, a memorable hook/mnemonic, a tiny worked example, and 3 active-recall flashcards (Q -> A). If you're unsure or a claim isn't standard, say so and reason from first principles instead of guessing.