Scalability and Performance (2)
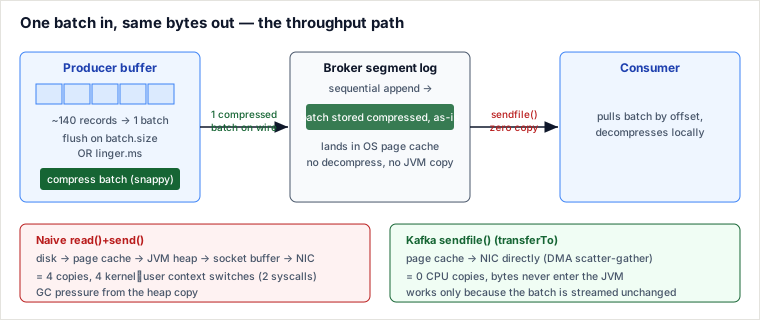
A single Kafka broker sustains hundreds of MB/s not by making each message fast but by amortizing the fixed per-message costs away: the producer packs hundreds of records into one batch, compresses that whole batch as a unit, the broker appends it sequentially to the OS page cache untouched, and on the way out ships those exact bytes to consumers with one sendfile() syscall that never copies them through the JVM.
Partitioning and consumer groups give Kafka horizontal scale — that mechanism is covered in Kafka Internals. This page is the other half: what makes a single broker/partition so fast. Three levers do the work — batching, compression, and zero-copy — and they interact.
1. Batching: amortize the fixed cost per record
Every produce request carries fixed overhead independent of payload size: a TCP round trip, request framing, a broker network-thread handoff, an offset/index update, and an ack. Sending one record per request pays that overhead one million times for one million records. Batching pays it once per batch.
The producer accumulates records per partition in an in-memory buffer and flushes the batch when either trigger fires first:
batch.size(default 16384 bytes) — flush when the batch fills.linger.ms(default 0) — flush after this long even if the batch is not full.
The default linger.ms=0 means "send as soon as the network is free" — under load it still batches opportunistically, but under a trickle it sends tiny batches. Raising it to 5–20 ms deliberately waits to build bigger batches: you trade a few ms of produce latency for a large drop in request count and much better compression.
2. A worked example
Ingest 1,000,000 events, each a ~100-byte JSON record, arriving at 200k/s. Records carry ~14 bytes of batch overhead each, so a 16 KB batch holds ≈ 16384 / 114 ≈ 140 records.
| Metric | A: linger.ms=0, no batching, no compression | B: linger.ms=10, batch.size=16384, snappy |
|---|---|---|
| Records per request | 1 | ~140 |
| Produce requests for 1M records | 1,000,000 | ~7,150 |
| Per-request overhead paid | 1,000,000× | ~7,150× (≈ 140× less) |
| Bytes appended & sent (payload) | ~114 MB | ~38 MB (snappy ≈ 3× on repetitive JSON → ~66% less network + disk) |
| Added produce latency (worst case) | 0 | ≤ 10 ms (a record that lands in an empty buffer) |
Compression runs on the whole batch, so the repeated JSON field names across those 140 records collapse into one dictionary — this is exactly why Kafka compresses batches, not individual messages: cross-record redundancy is where the ratio comes from.
3. Compression: pick the codec by your bottleneck
Set on the producer via compression.type; the broker default (compression.type=producer) keeps the producer's codec and stores the batch as received — which is what preserves zero-copy on the read path. The codec is a CPU-vs-bytes trade:
| Codec | Ratio (typical JSON) | CPU | Use when |
|---|---|---|---|
| none | 1× | none | Payload already compressed (images/video), or ultra-low latency |
| snappy | ~2–3× | low | CPU-tight or latency-sensitive; good default |
| lz4 | ~2–3× | low | Same class as snappy, often slightly faster |
| gzip | ~4–5× | high | Bytes/storage dominate and CPU is spare; slowest |
| zstd | ~4–5× | moderate | Best all-rounder (since Kafka 2.1): near-gzip ratio at far lower CPU |
4. Why the read path is nearly free
Two OS-level tricks, not Kafka code, carry most of the throughput:
- Sequential I/O + page cache. Kafka only ever appends to the tail of a segment file, so writes are sequential — no random-seek penalty — and the OS page cache absorbs them. Consumers reading recent data (the common case) hit that same cache, never the disk. Kafka deliberately keeps data in the OS cache instead of a JVM heap cache: no double-buffering and no GC pressure from multi-GB caches.
- Zero-copy send. A normal server read copies bytes disk→page-cache→app-buffer→socket-buffer→NIC (4 copies, 4 context switches — two per syscall, since each of
read()andsend()costs a user→kernel entry and a kernel→user return). Kafka callsFileChannel.transferTo()→ thesendfile()syscall → the kernel DMAs bytes straight from the page cache to the NIC. Zero CPU copies, and the payload never enters the JVM. This is only possible because the broker streams the stored batch unchanged — it does not decompress or reformat on read.
Pitfalls
- Leaving
linger.ms=0under low load. Batches flush half-empty → high request rate and poor compression ratios. Under a trickle, a smalllinger.ms(5–20 ms) is what actually creates batches worth compressing. - Tiny
batch.size, or too large withlinger.ms=0. Too small caps the batch before it fills; too large just holds producer buffer memory without helping unless linger lets it fill. - Broker recompression kills zero-copy. If the topic/broker forces a different
compression.typethan the producer used, the broker must decompress and recompress every batch — burning CPU and losing the ability tosendfile. Keepcompression.type=producerunless you have a reason not to. - TLS silently disables zero-copy. Encryption must transform bytes in userspace, so
sendfile()can't be used — enabling SSL can noticeably cut broker throughput. Budget for it. - Old-format consumers force down-conversion. On clusters still carrying pre-3.0-era message formats, a consumer on an older format makes the broker convert batches on read → again no zero-copy. Message formats v0/v1 and the
message.format.versionconfig were deprecated in Kafka 3.0 (KIP-724) and removed in 4.0, so this pitfall bites only legacy fleets — but keeping clients current remains the fix. - Batching + retries can reorder. With
retries>0andmax.in.flight.requests.per.connection>1, a retried batch can land after a later one. Turn onenable.idempotence=trueto keep per-partition order under retries and to deduplicate producer retries (PID + sequence numbers). That is not full end-to-end exactly-once processing: brokers can still deliver to consumers more than once, and side effects still need idempotent consumers (or Kafka transactions spanning produce+consume for a narrower EOS path).
Delivery honesty: idempotent producer ≠ EOS
| Knob | What it actually guarantees | What it does NOT |
|---|---|---|
enable.idempotence=true | Producer retries do not create duplicate records in a partition (same PID/epoch/seq) | Consumer-side EOS; cross-partition atomicity; "my email sent once" |
acks=all + min ISR | Committed data survives f-1 broker loss in the ISR | Zero consumer duplicates after rebalance |
| Kafka transactions (EOS) | Atomic consume-process-produce within the transactional API | Idempotency of external side effects (HTTP, SQL without keys) |
When NOT to chase EOS: most task pipelines want at-least-once + idempotent handlers. Full transactions cost latency and operational complexity; only pay when the business requires read-process-write atomicity on Kafka itself.
Operability signals
- Hot partition lag rising while others idle → skew in key distribution.
- Broker recompression CPU high → producer/topic compression mismatch (kills zero-copy).
- Request rate spike with low throughput →
linger.ms=0under trickle load.
When to lean on this — and when not
These are tuning strategies, so decide by what dominates your workload.
- Aggressive batching + high-ratio compression (
linger.ms20–100, largerbatch.size, zstd) — choose when throughput and cost (network egress, disk, broker count) dominate and consumers tolerate tens of ms of produce latency. Signals: log/metrics/clickstream ingestion, event sourcing, analytics pipelines. - Minimal batching (
linger.ms=0, snappy/lz4 or none) — choose when p99 latency matters and a user is effectively waiting on the event. You give up peak throughput to shave milliseconds.
Versus a push broker (RabbitMQ). RabbitMQ pushes messages individually, acks per message, and typically holds them in memory — you gain flexible routing, per-message priority/TTL, and low fan-out latency, but you cannot amortize per-message overhead the way Kafka's log does, so you won't reach Kafka's per-broker MB/s at the same CPU. Choose Kafka's log + batch + zero-copy model when volume is high and consumers pull streams they may replay; prefer RabbitMQ when per-message routing, priority, or the lowest single-message latency matter more than raw throughput.
Takeaways
- Throughput is an amortization story: batch to spread fixed per-request cost, compress the batch to cut bytes, and stream it unchanged so the kernel can
sendfileit copy-free. linger.msis the one knob that trades a few ms of latency for large batching + compression wins — the default 0 leaves that on the table under low load.- Zero-copy holds only while the broker stores and serves bytes untouched; recompression, TLS, and down-conversion each quietly turn it off.
- Pick the codec by bottleneck: zstd when bytes cost, snappy/lz4 when CPU or latency is tight, none when data is already compressed.
Re-authored and deepened for this guide, repositioned to Kafka's per-broker throughput mechanism (partitions/consumer-groups live in the Kafka Internals page). Sources: Apache Kafka documentation (producer configs — batch.size, linger.ms, compression.type; message format); Jay Kreps, "The Log" and the LinkedIn Kafka paper; Narkhede, Shapira & Palino, Kafka: The Definitive Guide; Linux sendfile(2) / Java NIO FileChannel.transferTo and the classic "Efficient data transfer through zero copy" write-up.
🤖 Don't fully get this? Learn it with Claude
Stuck on Scalability and Performance (2)? Open Claude, copy a block below, and it'll teach you this exact concept — visually and interactively.
Build the mental picture, not memorization.
I just read a lesson on **Scalability and Performance (2)** (System Design) and want to truly understand it. Explain Scalability and Performance (2) from first principles using ONE vivid real-world analogy and a visual mental model — draw it as ASCII art or a clear step-by-step diagram — with a concrete example using real numbers. Then ask me one question to check I got the mental picture, and wait for my reply. If you're unsure or a claim isn't standard, say so and reason from first principles instead of guessing.
Socratic — adapts to where you're stuck.
Teach me **Scalability and Performance (2)** interactively. Ask me ONE guiding question at a time, wait for my answer, and adapt to my confusion — build the idea with me step by step instead of explaining it all at once. If you're unsure or a claim isn't standard, say so and reason from first principles instead of guessing.
Active recall exposes what you missed.
Quiz me on **Scalability and Performance (2)** with 5 questions, easy to tricky, ONE at a time. Tell me if each answer is right; at the end, explain clearly what I got wrong and why. If you're unsure or a claim isn't standard, say so and reason from first principles instead of guessing.
Intuition + hook + flashcards for long-term memory.
Help me remember **Scalability and Performance (2)** for the long term: give the one-sentence intuition, a memorable hook/mnemonic, a tiny worked example, and 3 active-recall flashcards (Q -> A). If you're unsure or a claim isn't standard, say so and reason from first principles instead of guessing.