Debug the Defect — Find the Race in Real Code
The other concurrency problems in this guide are construction drills: given a spec, build a correct interleaving. This one is a diagnosis drill, which is the skill an on-call staff engineer actually sells. Nobody hands you a labelled race. They hand you a paging alert, a thread dump, and code that has been in production for eight months and "looks fine." The work is to read plausibly-correct concurrent code, locate the one planted defect, name the exact interleaving that fires it, and say which tool would have caught it before the page.
Five problems below. Each is a distinct class of defect — lost update, visibility, lock-order deadlock, lost wakeup, unsafe publication. For each: the symptom the on-call sees, the code, a "Find it" prompt that states the failing schedule explicitly, the fix, and the tool. Read the code and try to spot the bug before the "Find it" line. If you can do all five cold, you can run a concurrency incident.
How to read concurrent code for defects
Three questions catch most of what is below. (1) Is every compound action atomic? A sequence of
individually-safe operations (containsKey then put) is not itself safe. (2) Is
every shared mutable field either guarded by a lock on every access, or volatile/atomic? A
write with no happens-before edge to the read is invisible, not just late. (3) Does any path
acquire two locks, and can two threads acquire them in opposite orders? That is the whole of lock-order
deadlock. Hold those three questions in mind as you scan.
Problem 1 — The memoizing cache that computes twice
Symptom (on-call): A dashboard shows the "model warm-load" counter incrementing two or three times per distinct key under load, though it should be exactly once per key. The expensive loader (a 400 ms model fetch) is being paid redundantly; p99 latency spikes on cold keys. No exception, no crash — just waste, and occasionally a stale value served after a concurrent refresh.
// A per-key memoizer. ConcurrentHashMap is thread-safe — so this is safe. Right?
class Memoizer<K, V> {
    private final ConcurrentHashMap<K, V> cache = new ConcurrentHashMap<>();
    private final Function<K, V> loader;

    Memoizer(Function<K, V> loader) { this.loader = loader; }

    V getOrCompute(K key) {
        if (!cache.containsKey(key)) {         // check
            cache.put(key, loader.apply(key)); // compute + act
        }
        return cache.get(key);
    }
}
Find it. Each individual map operation is atomic; the sequence is not. The window is
between containsKey returning false and put completing:
key "gpt-oss" is absent.
T1: containsKey("gpt-oss") -> false
T2: containsKey("gpt-oss") -> false      // T1 has not put yet
T1: loader.apply(...)  // 400 ms fetch #1
T2: loader.apply(...)  // 400 ms fetch #2  <-- duplicate expensive compute
T1: put("gpt-oss", v1)
T2: put("gpt-oss", v2)  // clobbers v1; if loader isn't idempotent, wrong value wins
Using a thread-safe map removed the low-level corruption (no lost-update on the map's internal state) but did nothing for the check-then-act at the application level. This is the single most common concurrency mistake at the staff bar: "I used a concurrent collection, so I'm done." Atomicity of each call ≠ atomicity of the compound operation.
Fix & why. Make the check-compute-put one atomic operation the map itself owns:
V getOrCompute(K key) {
    return cache.computeIfAbsent(key, loader);  // at most one compute per key, atomically
}
computeIfAbsent holds the bin lock for that key across the whole test-and-set, so exactly one thread
runs the loader; the rest block and receive its result. (Caveat: the mapping function must not touch the same map,
and it runs under the bin lock, so keep it fast — for a slow loader,
Java Concurrency in Practice's ConcurrentHashMap<K, Future<V>> +
putIfAbsent pattern lets the compute run outside the lock while still deduplicating.)
Tool: code review is the primary catch — "compound operation on a thread-safe
collection" is a review smell you learn to see on sight. To demonstrate it, a load test that asserts
loaderInvocations == distinctKeys will fail intermittently; a jcstress actor test makes the double
compute routine. See the guide's Testing & Verifying
Concurrent Code.
Problem 2 — The worker that will not stop
Symptom (on-call): A graceful shutdown hangs. The service receives SIGTERM, calls
worker.stop(), and then never exits — the orchestrator kills it after the 30 s grace period. A
thread dump shows the worker thread RUNNABLE, pinned at 100% of one core, spinning inside its run
loop. The stop flag was set; the loop never noticed.
class Worker implements Runnable {
    private boolean running = true;     // toggled by one thread, read by another

    public void stop() { running = false; }   // called from the shutdown thread

    public void run() {                        // executes on the worker thread
        while (running) {
            pollAndProcess();
        }
    }
}
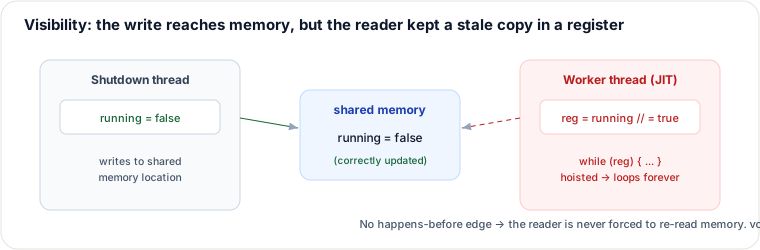
Find it. This is not an ordering bug you can draw as an interleaving of statements — it is a
visibility bug in the memory model. running is a plain field. The shutdown thread's write
running = false has no happens-before edge to the worker thread's read, so the JMM
gives the JVM full license to never propagate it. Worse, the JIT sees that nothing inside the loop writes
running, hoists the read out of the loop, and compiles this:
// what the JIT is allowed to emit — the read is done ONCE
if (running) { while (true) { pollAndProcess(); } }
Now the write is not merely late; it is unobservable. The loop spins forever on a value cached in a register. This reproduces reliably only after the method is hot enough to be JIT-compiled — which is why it survives every quick test and only bites in production.
Fix & why. Give the field a happens-before edge:
private volatile boolean running = true; // every read sees the latest write; no hoistingvolatile forbids the hoist and establishes: a write to a volatile happens-before every
subsequent read of it. AtomicBoolean works too and is preferable if you also need atomic
compare-and-set on the flag.
The Go equivalent is the same bug on a plain bool — and here you get a free
detector:
type Worker struct {
    running bool // DATA RACE: written in Stop, read in Run, no synchronization
}
func (w *Worker) Stop() { w.running = false }
func (w *Worker) Run() {
    for w.running {  // may loop forever
        w.pollAndProcess()
    }
}
Build with go test -race (or go run -race) and the race detector prints the write
in Stop and the read in Run as a data race, with both stacks. The idiomatic Go fix is a
done channel, not a flag — a closed channel is a broadcast every receiver observes:
done := make(chan struct{})
// Stop:  close(done)
func (w *Worker) Run(done <-chan struct{}) {
    for {
        select {
        case <-done:
            return
        default:
            w.pollAndProcess()
        }
    }
}
// or, for a single flag: sync/atomic's atomic.Bool (Go 1.19+)
Tool: in Go, the race detector catches it deterministically whenever the racy access
executes. In Java there is no built-in race detector; jcstress is the sound way to show the hoist under a
JMM-hostile JIT, and in an incident the thread dump (one thread RUNNABLE and spinning after a
stop was requested) is the fingerprint. Plain code review catches "non-volatile flag shared across threads."
Problem 3 — Two transfers, one deadlock
Symptom (on-call): The payments service stops processing on the transfer path. CPU is near zero
(not a hot loop this time), the request queue backs up, and two pool threads have been BLOCKED for
minutes. Restarting clears it — until it happens again under concurrent transfers between the same two
accounts.
void transfer(Account a, Account b, long amount) {
    synchronized (a) {              // lock the source
        synchronized (b) {          // lock the destination
            a.debit(amount);
            b.credit(amount);
        }
    }
}
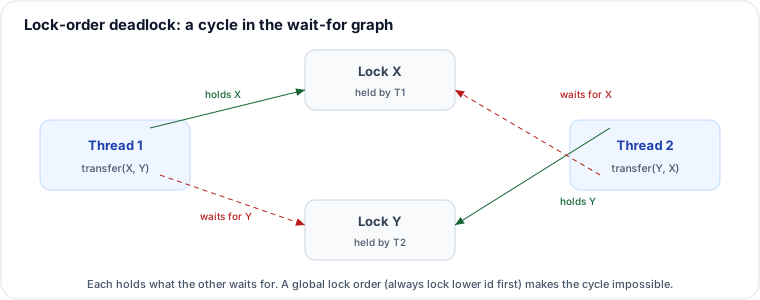
Find it. Two threads transferring in opposite directions acquire the two locks in opposite orders:
T1: transfer(X, Y, 100)          T2: transfer(Y, X, 50)
T1: synchronized(X)  // holds X
                                 T2: synchronized(Y)  // holds Y
T1: synchronized(Y)  // BLOCKED — Y held by T2
                                 T2: synchronized(X)  // BLOCKED — X held by T1
// neither will ever release; each waits for a lock the other holds
This is a wait-for cycle: T1 → (waits for Y, held by) T2 → (waits for X, held by) T1. Any lock protocol with a cycle in its wait-for graph can deadlock.
The thread dump proves it. jstack not only shows two BLOCKED threads,
it runs a deadlock detector and prints the cycle:
Found one Java-level deadlock:
=============================
"pool-1-thread-1":
  waiting to lock <0x000000076ab12440> (a Account),   // Y
  which is held by "pool-1-thread-2"
"pool-1-thread-2":
  waiting to lock <0x000000076ab12460> (a Account),   // X
  which is held by "pool-1-thread-1"
Two threads, each waiting to lock <0x...> which is held by the other — that "held by
the one waiting on me" pattern is the deadlock signature.
Fix & why. Break the cycle by imposing a global lock order: every thread acquires the two accounts in the same order, by a stable id, so no cycle can form.
void transfer(Account a, Account b, long amount) {
    Account first  = a.id < b.id ? a : b;   // always lock lower id first
    Account second = a.id < b.id ? b : a;
    synchronized (first) {
        synchronized (second) {
            a.debit(amount);
            b.credit(amount);
        }
    }
}
// tie-break: if a.id == b.id it's the same account (or use a shared tie-break lock
// when ids can collide, e.g. System.identityHashCode).
Alternatively, ReentrantLock.tryLock with a timeout and back-off: attempt both locks, and if the
second fails, release the first, wait a jittered interval, and retry — trading the guarantee for liveness
without a global order. Ordering is simpler and preferred when a stable key exists.
Tool: thread dump / jstack (its built-in deadlock detector names the cycle); in review, "acquires two locks" plus "no documented lock order" is the flag. See Deadlock, Livelock & Starvation.
Problem 4 — The bounded queue that drains empty
Symptom (on-call): Under heavy load with several producer and consumer threads, the queue
throws NoSuchElementException from take() a few times an hour, and once in a while a
producer or consumer hangs permanently — a thread dump shows several threads WAITING even
though the queue is neither full nor empty. Light load never reproduces it.
class BoundedQueue<T> {
    private final Queue<T> q = new ArrayDeque<>();
    private final int cap;
    BoundedQueue(int cap) { this.cap = cap; }

    synchronized void put(T x) throws InterruptedException {
        if (q.size() == cap) wait();   // wait for space
        q.add(x);
        notify();                      // wake "a" waiter
    }
    synchronized T take() throws InterruptedException {
        if (q.isEmpty()) wait();       // wait for an item
        T x = q.remove();
        notify();
        return x;
    }
}
Find it. Two defects, both fatal. First, if instead of while around
the wait. After wait() returns, the predicate is assumed true — but it may not be, because
of a stale wakeup:
queue empty.
C1: take(): isEmpty -> true, wait()          // parks, releases lock
P1: put(): add(x), notify()                  // wakes C1, but C1 must re-acquire the lock
C2: take(): acquires lock first, isEmpty -> false, remove(x)   // steals the only item
C1: re-acquires lock, wait() returns          // <-- with 'if', does NOT re-check
C1: q.remove()  // queue is empty again -> NoSuchElementException
Second, notify() on a monitor where producers wait on "not full" and consumers wait on "not empty"
can wake the wrong class of waiter. That waiter re-checks (once you fix the while), finds its
own predicate false, and goes back to sleep — while the waiter that could have progressed was never
woken. That is a lost wakeup, and it is your permanent hang:
cap=1, queue full, and two producers already parked in put().
C1: take(): remove(x), notify()   // intends to wake a PRODUCER (space now exists)
// notify() picks ONE arbitrary waiter. If it wakes P1, good.
// But if consumers are also parked here, notify() can wake a CONSUMER instead:
//   that consumer re-checks isEmpty -> true -> waits again (no progress),
//   and the producers sleep on, though space exists -> lost wakeup, permanent stall.
Fix & why. Re-check in a while (a wakeup is a hint, not a guarantee), and signal
the right waiter. The cleanest version uses one lock with two conditions:
private final ReentrantLock lock = new ReentrantLock();
private final Condition notFull  = lock.newCondition();
private final Condition notEmpty = lock.newCondition();

void put(T x) throws InterruptedException {
    lock.lock();
    try {
        while (q.size() == cap) notFull.await();  // while, not if
        q.add(x);
        notEmpty.signal();                        // wake a CONSUMER specifically
    } finally { lock.unlock(); }
}
T take() throws InterruptedException {
    lock.lock();
    try {
        while (q.isEmpty()) notEmpty.await();
        T x = q.remove();
        notFull.signal();                         // wake a PRODUCER specifically
        return x;
    } finally { lock.unlock(); }
}
Two conditions mean a signal always targets a waiter whose predicate just became true, so there is no
wrong-waiter class. If you must stay on the intrinsic monitor, use notifyAll() (wake everyone; the
losers re-check and re-sleep) — correct but wasteful. And keep the while: spurious wakeups are
permitted by the spec even with no notifier at all.
Tool: a multi-producer/multi-consumer stress test that runs the pair for millions of
iterations surfaces both the exception and the stall; jcstress formalizes it. In an incident, the
thread dump signature is threads WAITING on the monitor while the queue is provably
non-empty and non-full — the lost-wakeup tell. In review, if-around-wait and a lone
notify() with heterogeneous waiters are both red flags. See
Condition Variables.
Problem 5 — The singleton that hands out a half-built object
Symptom (on-call): A rare NullPointerException reading
config.get("region"), or a caller occasionally sees an empty settings map from a config
object that is definitely fully initialized. It only appears after the JVM has warmed up, only under concurrency,
and disproportionately on the ARM (Graviton) fleet. "Cannot reproduce locally" is written all over the ticket.
class Config {
    private static Config instance;             // the publication field
    private Map<String, String> settings;       // NOT final — a final field would be safely published (JLS 17.5) and hide this bug

    private Config() { this.settings = load(); }  // real construction work

    static Config getInstance() {
        if (instance == null) {                    // 1) fast path, no lock
            synchronized (Config.class) {
                if (instance == null) {            // 2) double check under lock
                    instance = new Config();       // 3) construct + publish
                }
            }
        }
        return instance;
    }
}
Find it. This is textbook double-checked locking, and the field is not
volatile — which makes it broken. The statement instance = new Config() is not
atomic. It is three sub-steps the compiler/CPU may reorder:
a) allocate memory for Config
b) run the constructor (settings = load())
c) publish: instance = <that address>

Legal reordering without volatile:  a) allocate   c) publish   b) construct

T1: a) allocate, c) instance = ref     // instance is now non-null...
                                        // ...but settings is still null (b hasn't run)
T2: getInstance(): instance == null? NO  -> returns the reference on the FAST PATH
T2: config.settings.get("region")        // settings == null -> NPE / empty map
T1: b) settings = load()                 // too late; T2 already read the half-built object
T2 never takes the lock, so nothing forces it to wait for T1's constructor. It sees a non-null reference to an object whose fields have not been published. On x86's strong memory model this is hard to hit; on weaker models (ARM) the reordering is real and observed — hence the Graviton skew.
Fix & why. Either make the field volatile, or drop DCL for the
initialization-on-demand holder idiom (preferred):
// Option A: volatile — the write to a volatile happens-before every read,
// and volatile forbids the a)/c) reorder, so publication implies full construction.
private static volatile Config instance;

// Option B (preferred): holder idiom — no lock, no volatile, lazy and thread-safe
class Config {
    private Config() { /* ... */ }
    private static class Holder {           // not loaded until first getInstance()
        static final Config INSTANCE = new Config();
    }
    static Config getInstance() { return Holder.INSTANCE; }
}
The holder idiom leans on the JLS class-initialization guarantee: a class is initialized lazily, exactly once, and that initialization happens-before any thread's use of it — the JVM gives you safe publication for free, with no volatile and no synchronization on the hot path.
Tool: jcstress is the only sound way to demonstrate this — it is a
publication/reordering bug in the Java Memory Model, so a plain unit test cannot catch it (the object "is there"),
a thread dump shows nothing, and Go's -race has no analogue for the JVM. In review, "double-checked
locking without a volatile field" is a canonical catch. See
Memory Model, Visibility & volatile and
Atomics & CAS.
The diagnosis playbook
Every problem above followed the same four beats. That loop is the transferable skill: read the symptom, pick the tool that can prove it, name the interleaving, apply the fix that removes the schedule (not just the current occurrence).
| Symptom | Tool that catches it | The interleaving | Fix |
|---|---|---|---|
| Duplicate expensive computes; occasional wrong/stale value | Code review; load test asserting compute-count; jcstress | Two threads both pass the check before either does the act | Make the compound op atomic (computeIfAbsent) |
Thread won't stop; one core pinned, RUNNABLE in dump |
Go -race; jcstress (Java); thread dump; review |
None — a write with no happens-before edge, hoisted by JIT | volatile/AtomicBoolean; Go: done channel / atomic.Bool |
Path stalls; near-zero CPU; two BLOCKED threads |
Thread dump (jstack deadlock detector) |
Two threads acquire two locks in opposite order → wait-for cycle | Global lock order by id; or tryLock + back-off |
Rare NoSuchElementException; permanent hang under load |
MPMC stress test; jcstress; thread dump (WAITING) |
Stale wakeup after if; single notify() wakes wrong-class waiter |
while predicate + two Conditions (or notifyAll) |
| Rare NPE / empty state; only warm, only under load, ARM-skewed | jcstress (only sound option); code review | Publish reordered before construct; reader takes fast path | volatile field, or holder idiom |
Two habits generalize past these five. "It passed" is nearly no evidence for a concurrency bug
— the buggy schedule is rare, not absent, so you must force it (latch/stress) or detect it independent of
schedule (-race, jcstress). And fix the schedule, not the symptom: adding a
Thread.sleep or a retry that "makes it stop happening" only lengthens the odds — the wait-for
cycle, the missing happens-before edge, the non-atomic compound op are still there, waiting for the next unlucky
interleaving.
Takeaways
- Atomicity of each call ≠ atomicity of the sequence. A thread-safe collection does not make check-then-act safe (Problem 1).
- A shared mutable field needs a happens-before edge — a lock on every access, or
volatile/atomic. Without it, writes are invisible, not just late (Problems 2, 5). - Any two-lock path with no agreed order can deadlock. Impose a global order or use timed
tryLock(Problem 3). - A wakeup is a hint. Always re-check the predicate in a
while, and signal the specific condition (Problem 4). - Match the tool to the failure class: race detector and jcstress detect regardless of schedule; a thread dump names deadlocks and stalls; review catches the smells before any of it pages you.
Synthesized for this guide; wait-for-cycle and visibility diagrams hand-authored as SVG. All buggy and fixed snippets are compilable as stated. Sources: Brian Goetz et al., Java Concurrency in Practice (memoizer ch. 5, publication & DCL ch. 16, deadlock ch. 10, conditions ch. 14); the Go race detector documentation; OpenJDK jcstress and JMH harnesses. See also: Testing & Verifying Concurrent Code.
🤖 Don't fully get this? Learn it with Claude
Stuck on Debug the Defect — Find the Race in Real Code? Open Claude, copy a block below, and it'll teach you this exact concept — visually and interactively.
Build the mental picture, not memorization.
I just read a lesson on **Debug the Defect — Find the Race in Real Code** (Concurrency) and want to truly understand it. Explain Debug the Defect — Find the Race in Real Code from first principles using ONE vivid real-world analogy and a visual mental model — draw it as ASCII art or a clear step-by-step diagram — with a concrete example using real numbers. Then ask me one question to check I got the mental picture, and wait for my reply. If you're unsure or a claim isn't standard, say so and reason from first principles instead of guessing.
Socratic — adapts to where you're stuck.
Teach me **Debug the Defect — Find the Race in Real Code** interactively. Ask me ONE guiding question at a time, wait for my answer, and adapt to my confusion — build the idea with me step by step instead of explaining it all at once. If you're unsure or a claim isn't standard, say so and reason from first principles instead of guessing.
Active recall exposes what you missed.
Quiz me on **Debug the Defect — Find the Race in Real Code** with 5 questions, easy to tricky, ONE at a time. Tell me if each answer is right; at the end, explain clearly what I got wrong and why. If you're unsure or a claim isn't standard, say so and reason from first principles instead of guessing.
Intuition + hook + flashcards for long-term memory.
Help me remember **Debug the Defect — Find the Race in Real Code** for the long term: give the one-sentence intuition, a memorable hook/mnemonic, a tiny worked example, and 3 active-recall flashcards (Q -> A). If you're unsure or a claim isn't standard, say so and reason from first principles instead of guessing.