hard Deriving the Peak Factor (not memorizing x2-10)
The peak factor is measured, not memorized
Every estimation guide says peak QPS = average QPS × 2–10, as if 2–10 were physics. It isn't — it's the ratio between how your traffic is actually spread across time and how it would look if it were spread evenly. That ratio is computable from the shape of your own traffic curve, so you never have to guess where in "2 to 10" your system lands.
peak factor = (fraction of traffic inside a time window) ÷ (fraction of the total time that window occupies)
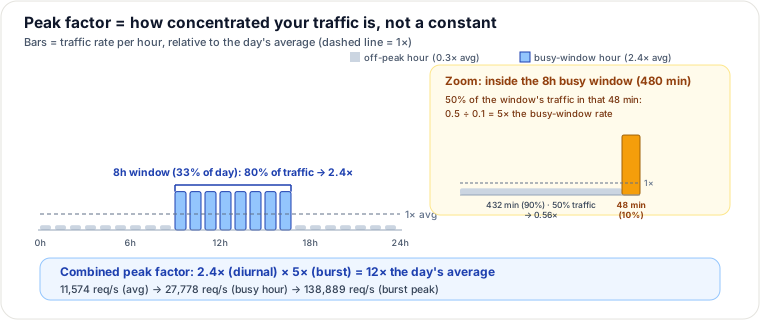
Concentrate 50% of a day's requests into 10% of the day's minutes and the rate inside that window is 0.5 ÷ 0.1 = 5× the day's average — no lookup table, just the shape of the curve. The diagram below traces exactly this, in two compounding layers.
Layer 1 — diurnal concentration (the ×2–3 you always see)
Start from the baseline: 1B requests/day → average rate = 1,000,000,000 ÷ 86,400 ≈ 11,574 requests/second, if traffic were perfectly uniform across all 24 hours.
It never is. Say 80% of the day's requests land inside working hours — an 8-hour window, i.e. 1/3 of the day:
- Requests inside the window: 0.8 × 1,000,000,000 = 800,000,000.
- Window duration: 8 × 3,600 = 28,800 seconds.
- Rate inside the window: 800,000,000 ÷ 28,800 ≈ 27,778 req/s.
- Peak factor so far: 27,778 ÷ 11,574 = 2.4× — and it falls straight out of the general rule: 0.8 ÷ (8 ÷ 24) = 0.8 ÷ 0.333 = 2.4.
This layer alone explains the "×2–3" end of the folklore range: any traffic with a normal business-hours or evening-peak shape lands around here.
Layer 2 — burst inside the busy window (where ×5–10 comes from)
The 8-hour window itself isn't uniform either. A cron job that fires every client at the top of the hour, a push notification blast, a celebrity's post going viral — each squeezes a chunk of that window's traffic into a much shorter stretch. Say half of the busy window's 800M requests actually land in a single 48-minute stretch (10% of the window's 480 minutes):
- Requests in the burst: 0.5 × 800,000,000 = 400,000,000.
- Burst duration: 10% × 480 min = 48 min = 2,880 seconds.
- Rate during the burst: 400,000,000 ÷ 2,880 ≈ 138,889 req/s.
- Burst factor relative to the busy window's own average (27,778 req/s): 138,889 ÷ 27,778 = 5× — the same rule again: 0.5 ÷ 0.1 = 5.
Multiply the two layers and you get the true peak-to-average ratio for the day:
| Stage | Window | Traffic share | Time share | Rate | × of daily avg |
|---|---|---|---|---|---|
| Daily average | 24 h | 100% | 100% | 11,574 req/s | 1× |
| Busy window (diurnal) | 8 h | 80% | 33.3% | 27,778 req/s | 2.4× |
| Burst (flash event) | 48 min | 50% of the window | 10% of the window | 138,889 req/s | 12× |
2.4 × 5 = 12× the daily average — the rate you'd actually need to survive a flash event landing inside your normal busy hours, derived from the traffic's shape rather than pulled from a range.
Pitfalls
- Provisioning for the average, not the peak. Sizing a fleet or connection pool off 11,574 req/s when the real busy-second load is 138,889 req/s is a brownout waiting to happen — queues back up, latency spikes, and retries pile on and make it worse.
- Applying a memorized factor to a traffic shape it doesn't fit. "×2–10" describes a normal business-hours-plus-burst curve. A niche or global product can be far more concentrated (a single regional lunch spike, an alarm-clock app hitting a 6–7am wall) or far less (steady IoT telemetry) — the honest move is to derive the ratio from real logs, not assume the range applies to you.
- Ignoring flash crowds and self-reinforcing bursts. A viral post or a marketing push can blow well past the "×10" ceiling; and once a system is overloaded, client retries compress even more traffic into the next few seconds — the burst layer keeps compounding until something sheds load.
- Measuring the ratio from a calm sample window. If your logs only cover a quiet week, the derived peak factor will miss the one event a quarter that actually matters (Black Friday, a launch day).
Judgment: provision-for-peak vs. autoscale-with-headroom
Once you have a derived number (12× here, not "somewhere between 2 and 10"), you still choose how to meet it:
- Provision for the derived peak — keep standing capacity near 138,889 req/s worth of resources. Use it when the peak is predictable (a known daily cycle, a scheduled batch job), when the component can't scale in seconds (a primary database, a stateful cache), or when a brownout at peak costs far more than idle capacity the rest of the day.
- Autoscale with headroom — run near the average, add a buffer, and let an autoscaler add capacity as load climbs. Use it for stateless, horizontally-scalable tiers where spin-up is fast and traffic is genuinely variable, and where paying for 138,889 req/s of capacity 24 hours a day to use it for 48 minutes is wasteful.
- The trade-off: static peak provisioning guarantees no brownout but is expensive — most of the day you're using well under 10% of the fleet you're paying for. Autoscaling is cost-efficient but has a lag window (detect → spin up → warm) during which you're under capacity right when the burst starts, the one moment you can't afford it. The senior-engineer answer is usually both: bake the derived diurnal peak (2.4×, predictable) into baseline capacity, and autoscale — or shed load with backpressure/queueing — for the burst layer on top, because that layer is the part that genuinely can't be provisioned for in advance.
Takeaways
- Peak factor = (fraction of traffic in a window) ÷ (fraction of time that window is) — derive it from your own traffic shape instead of quoting "×2–10."
- It compounds in layers: diurnal concentration (day → busy hour, typically ×2–3) and burst concentration (busy hour → busy minute/second, the source of ×5–10+); multiply them for the real worst case.
- The "×2–10" folklore describes a typical shape, not a hard ceiling — a real flash crowd compounds past it, which is exactly why you derive rather than memorize.
- Provision predictable peaks (diurnal) as standing capacity; autoscale or shed load for the burst layer — and know the autoscaler's lag window is itself a risk at the worst possible moment.
The concentration-ratio derivation (fraction of traffic ÷ fraction of time) is first-principles arithmetic; the commonly-quoted "peak = average × 2–10" figure appears across estimation guides including the System Design Primer, Grokking the System Design Interview, and ByteByteGo — this page derives where that range actually comes from instead of restating it. See also: QPS & Throughput Playbook, The Estimation Method, Tail Latency & Fan-out Amplification.
🤖 Don't fully get this? Learn it with Claude
Stuck on Deriving the Peak Factor (not memorizing x2-10)? Open Claude, copy a block below, and it'll teach you this exact concept — visually and interactively.
Build the mental picture, not memorization.
I just read a lesson on **Deriving the Peak Factor (not memorizing x2-10)** (System Design) and want to truly understand it. Explain Deriving the Peak Factor (not memorizing x2-10) from first principles using ONE vivid real-world analogy and a visual mental model — draw it as ASCII art or a clear step-by-step diagram — with a concrete example using real numbers. Then ask me one question to check I got the mental picture, and wait for my reply. If you're unsure or a claim isn't standard, say so and reason from first principles instead of guessing.
Socratic — adapts to where you're stuck.
Teach me **Deriving the Peak Factor (not memorizing x2-10)** interactively. Ask me ONE guiding question at a time, wait for my answer, and adapt to my confusion — build the idea with me step by step instead of explaining it all at once. If you're unsure or a claim isn't standard, say so and reason from first principles instead of guessing.
Active recall exposes what you missed.
Quiz me on **Deriving the Peak Factor (not memorizing x2-10)** with 5 questions, easy to tricky, ONE at a time. Tell me if each answer is right; at the end, explain clearly what I got wrong and why. If you're unsure or a claim isn't standard, say so and reason from first principles instead of guessing.
Intuition + hook + flashcards for long-term memory.
Help me remember **Deriving the Peak Factor (not memorizing x2-10)** for the long term: give the one-sentence intuition, a memorable hook/mnemonic, a tiny worked example, and 3 active-recall flashcards (Q -> A). If you're unsure or a claim isn't standard, say so and reason from first principles instead of guessing.