Designing Google Maps — Tiles, Routing Tiles & ETA, Traced
Three services wearing one app
"Design Google Maps" is really three loosely related systems, and conflating them is the most common way the question goes wrong:
- Rendering — show the map. A read-mostly, enormous-static-asset problem.
- Navigation — find the best route and estimate arrival time. A graph-search problem over a graph too large to hold in memory.
- Location — ingest where hundreds of millions of devices are, which is what makes traffic data (and therefore ETAs) possible at all. A write-heavy streaming problem.
They have different shapes, different bottlenecks and different failure modes. The connective tissue between them is one idea used twice: precompute into immutable tiles, addressed by coordinates.
Scope worth pinning down
- Rendering the map, turn-by-turn navigation, and ETA — with traffic.
- Roughly 1 billion monthly users, tens of millions navigating concurrently at peak.
- Mobile-first: bandwidth and battery are real constraints, not afterthoughts.
- Not in scope here: business listings, reviews, Street View imagery.
First, the projection problem
The Earth is a sphere and screens are flat, so a map projection is required and every projection distorts something. Web maps almost universally use Web Mercator, which preserves angles (shapes look right locally, and a road meeting another at 90° renders at 90°) at the cost of grossly inflating area far from the equator — the reason Greenland looks continental. Mercator is chosen because local shape-correctness is what navigation needs, and because it maps the world onto a square that subdivides cleanly into four quadrants — which is precisely what makes the tile scheme below work.
Rendering: why tiles, and why they are static files
The naive design renders a custom image for each user's viewport. That is catastrophic: you would run a rendering farm sized for peak concurrent panning, and cache nothing, because every viewport is slightly different.
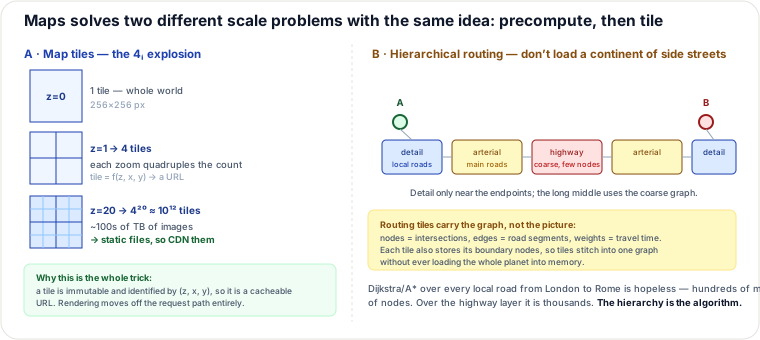
Instead, quantize. The world is divided into a grid of tiles, typically 256×256 pixels, at
discrete zoom levels. Zoom 0 is one tile containing the whole world; each level subdivides every tile
into four, so level z has 4ᵢ tiles. A client computes which tiles its viewport covers and requests
them by (z, x, y) — a pure function of coordinates, which means a tile is a
URL.
Everything good follows from that:
- Tiles are precomputed offline, so rendering is not on the request path.
- Tiles are immutable until the map data changes, so they are perfectly cacheable — browser, device, and CDN.
- Two users looking at the same city request the same bytes, which is what makes a >99% CDN hit rate achievable, and that hit rate is the difference between a viable product and an impossible bandwidth bill.
The cost is the 4ᵢ explosion: zoom 20 implies ~10¹² tiles, hundreds of terabytes. Nobody renders all of them — you pre-render deep zooms only where people actually look (cities), and render rare deep tiles on demand, caching the result. The long tail of the planet at maximum zoom is mostly ocean and desert that no one requests.
Two refinements worth naming: vector tiles ship geometry rather than pixels, letting the client restyle, rotate and label without new downloads — smaller over the wire, more client CPU. And tiles split by layer (base map, traffic overlay, labels) so the volatile traffic layer can have a 1-minute TTL while the base map has a 30-day TTL. Mixing a fast-changing overlay into the base tile would destroy its cacheability, which is the same change-rate-boundary rule that governs cache tiers in a news feed.
Navigation: the road graph, and why plain Dijkstra loses
Roads are a weighted directed graph: nodes are intersections, edges are road segments, and edge weight is travel time (not distance — a 2 km jam is worse than 5 km of open highway). Direction matters for one-way streets, and turn restrictions are edge-to-edge constraints rather than node properties.
Now the scale problem. A continental road network has hundreds of millions of nodes. Dijkstra explores outward uniformly and would visit most of them for a long route; A* with a straight-line-distance heuristic prunes toward the destination and helps materially, but neither is remotely fast enough for a cross-country route at interactive latency, and neither fits in one machine's memory.
Two structural ideas fix it:
- Routing tiles. The graph is partitioned geographically into tiles, each holding its internal graph plus its boundary nodes — the points where roads cross the tile edge. A router loads only the tiles it needs and stitches them together at boundary nodes. The graph becomes streamable instead of resident.
- Hierarchy. Maintain several layers: local streets, arterial roads, highways. A long route uses detail only near its endpoints and the coarse highway layer for the long middle — which is exactly what a human does with an atlas. The highway layer has thousands of nodes where the full graph has hundreds of millions, so the search space collapses by orders of magnitude.
This is why "use Dijkstra" is an incomplete answer: the algorithm is not the hard part, the graph representation is. Real systems go further with precomputation such as contraction hierarchies, which shortcut whole paths offline so queries become near-lookups — the same precompute-then-serve instinct as the map tiles, applied to paths.
ETA, and why it needs the location service
An ETA is the sum of edge travel times along the route, but the useful version is time-dependent: an edge's weight changes with time of day and with live traffic. So edge weights come from two sources — historical speed profiles per road per time-of-day-and-weekday, and a live speed estimate derived from current device telemetry. The genuinely hard part is that a long route finishes in the future: for the final leg, you must predict conditions at the time the driver will arrive there, not conditions now. That is why ETA is a prediction problem layered on a graph problem, and why it can be confidently wrong in ways routing cannot.
Location ingestion: the write-heavy half
Traffic data comes from users' devices reporting position and speed. This is the highest-volume path in the system and the design choice is batching versus streaming:
- Batched updates — the client buffers points and uploads every ~15–30 seconds. Far fewer requests, much better battery and radio behaviour (a mobile radio waking up is the expensive part, not the bytes), at the cost of staleness.
- Streaming — continuous updates for the user actively navigating, who needs immediate rerouting when they miss a turn.
The right answer is both, chosen by role: batch from passive users (whose value is aggregate traffic, where seconds do not matter), stream for the actively-navigating user (where they do). Ingested points land on a message queue, then feed two consumers — a stream processor updating live road speeds, and a warehouse accumulating history for the speed profiles.
Partitioning: location writes are partitioned geospatially, with geohashing turning a latitude/longitude pair into a string prefix so nearby points share a prefix and land on the same shard. That gives locality for the "what is the speed on this road right now" query. It also inherits geohash's known weaknesses — neighbouring points can straddle a prefix boundary and land far apart, and dense cities create hot shards while oceans create empty ones. (Both are covered in this guide's Geohashing & Quadtrees page.)
Privacy is a design constraint here, not a footnote
A continuous location feed keyed to a user is among the most sensitive data any system holds. The mitigations are architectural: aggregate early so the traffic layer stores road speeds rather than trajectories; retain raw per-device points only briefly; and require a minimum number of contributing devices before publishing a segment's speed, so an individual's movement cannot be inferred from a lightly-travelled road. A design that stores raw trajectories indefinitely has created a liability that no amount of access control fully contains.
Which approach, when
| Decision | Option | Choose when | Breaks when |
|---|---|---|---|
| Rendering | Precomputed raster tiles + CDN | Mass-market map viewing | Client needs restyling/rotation; you re-render for every theme |
| Rendering | Vector tiles | Client restyling, rotation, offline maps | Weak client CPU; more complex renderer |
| Rendering | Render per request | Custom cartography, low traffic, internal tools | Consumer scale — you cache nothing |
| Routing | Hierarchy + routing tiles | Continental routing at interactive latency | Complex build pipeline; hierarchy can miss clever local shortcuts |
| Routing | A* on the full graph | City-scale, or a single metro area | Long routes — search space and memory both explode |
| Routing | Contraction hierarchies | Static weights, fastest possible queries | Live traffic — changing weights invalidates precomputation |
| Location | Batched upload | Passive users feeding traffic aggregates | Active navigation — rerouting must be immediate |
| Location | Streaming upload | Actively navigating users | Applied to everyone — battery and ingest cost explode |
Note the tension in rows 6 and 3 together: the more you precompute, the worse you handle live traffic. Contraction hierarchies give near-instant routes over a graph whose weights you promised not to change; live traffic changes weights constantly. Production systems resolve this by precomputing over stable weights and applying live traffic as a correction on a limited set of affected edges — accepting that a route during an unusual jam is good rather than provably optimal.
Pitfalls
- Traffic baked into base map tiles. The volatile layer destroys the cacheability of the stable one; keep layers and TTLs separate.
- Weighting edges by distance instead of travel time. Produces confidently wrong "shortest" routes through congested side streets.
- Ignoring boundary nodes when partitioning the graph, so routes cannot cross tile edges — the router silently refuses long routes or takes absurd detours.
- Streaming location from every device. The classic scaling mistake here; batch the passive majority.
- Pre-rendering every tile at every zoom. Enormous cost for tiles nobody requests; render the deep tail on demand.
- ETA using current speeds for the whole route. Fine for a 5-minute trip, badly wrong for a 5-hour one, where the later legs must be predicted forward in time.
- Publishing per-segment speed from one device. A privacy leak disguised as a data-sparsity problem.
Cost model — what dominates the bill
Maps is egress-dominated, and by a wide margin. Tiles are images requested constantly by hundreds of millions of devices, which makes CDN hit rate the single most important number in the entire cost structure.
Rough BOTE. Say 100 million daily active users, each loading ~50 tiles per session at ~20 KB per tile: that is 100M × 50 × 20 KB = 100 TB/day of tile traffic, ~3 PB/month. At roughly $0.02/GB CDN egress, 3 PB would be about $60,000/month if every byte were billable — and this is precisely why the numbers that matter are client cache and CDN offload. A 90% client-cache hit rate turns that into $6,000/month; the same traffic served from origin instead of CDN would cost several times more and saturate the origin.
Storage is large but cheap and one-time-ish: hundreds of TB of pre-rendered tiles at ~$0.02/GB-month is on the order of several thousand dollars monthly, and it does not grow with traffic. The location pipeline is the surprising one: at 100 million devices reporting a batch every 30 seconds, that is 100,000,000 / 30 ≈ 3.3 million writes/second into the ingest tier — a genuinely large streaming system whose cost is compute and queue throughput, not storage, since raw points are discarded quickly.
Dominant line items: CDN egress for tiles; then location-ingest stream processing; then tile storage; then routing compute (surprisingly modest, because the hierarchy makes each query cheap).
Levers, in order of leverage: (1) aggressive client-side tile caching with long TTLs on the base map — every cache hit is a request that costs nothing; (2) vector tiles, which are smaller over the wire and let one download serve multiple styles and rotations; (3) batching location uploads, which cuts ingest volume proportionally to the batch window; (4) rendering deep-zoom tiles on demand rather than pre-rendering the planet.
Operability: the fingerprints of a broken maps stack
The three subsystems fail in recognizably different ways. CDN hit rate dropping while traffic is flat is nearly always a cache-key or TTL change — a new query parameter on the tile URL, or traffic data leaking into base tiles — and it shows up as an origin bandwidth spike and a cost alarm rather than as a user-visible error. Blank or checkerboard tiles at high zoom in one region means the pre-render pipeline failed for that area or the on-demand renderer is timing out; the region-shaped blast radius is the giveaway.
Routes that refuse to cross a particular line on the map is the boundary-node fingerprint — a routing tile built without correct boundary stitching, which manifests as absurd detours or outright failures for origin/destination pairs that straddle one specific edge. ETAs accurate for short trips and badly wrong for long ones means the model is applying current conditions across the whole route rather than predicting forward.
On the ingest side, one geospatial shard running far hotter than its peers is a dense-city hot shard, which is inherent to geohash partitioning rather than a bug — the fix is finer subdivision for that prefix, not more hardware. Live road speeds going stale in a region while ingest volume looks healthy usually means the minimum-device threshold is suppressing publication, which is the privacy guard behaving correctly on a quiet road and incorrectly if the threshold is set too high for rural coverage.
Signals worth having: CDN hit rate split by tile layer and zoom, origin egress, tile-render queue depth and on-demand render latency, route failures grouped by tile pair, ETA error distribution bucketed by trip duration, ingest writes/second with per-shard skew, and road-segment staleness with suppressed-by-threshold counts.
Authored for this guide to cover the Google Maps design (Alex Xu Vol. 2, ch. 18 — not present in the Vol. 1 PDF); tile-pyramid and hierarchical-routing diagram hand-authored as SVG. Builds on this guide's Geohashing & Quadtrees, CDN, and (DSA) Dijkstra / A* pages; see also "Designing Uber — Geospatial Matching, Traced" for the matching side of geospatial systems.
🤖 Don't fully get this? Learn it with Claude
Stuck on Designing Google Maps — Tiles, Routing Tiles & ETA, Traced? Open Claude, copy a block below, and it'll teach you this exact concept — visually and interactively.
Build the mental picture, not memorization.
I just read a lesson on **Designing Google Maps — Tiles, Routing Tiles & ETA, Traced** (System Design) and want to truly understand it. Explain Designing Google Maps — Tiles, Routing Tiles & ETA, Traced from first principles using ONE vivid real-world analogy and a visual mental model — draw it as ASCII art or a clear step-by-step diagram — with a concrete example using real numbers. Then ask me one question to check I got the mental picture, and wait for my reply. If you're unsure or a claim isn't standard, say so and reason from first principles instead of guessing.
Socratic — adapts to where you're stuck.
Teach me **Designing Google Maps — Tiles, Routing Tiles & ETA, Traced** interactively. Ask me ONE guiding question at a time, wait for my answer, and adapt to my confusion — build the idea with me step by step instead of explaining it all at once. If you're unsure or a claim isn't standard, say so and reason from first principles instead of guessing.
Active recall exposes what you missed.
Quiz me on **Designing Google Maps — Tiles, Routing Tiles & ETA, Traced** with 5 questions, easy to tricky, ONE at a time. Tell me if each answer is right; at the end, explain clearly what I got wrong and why. If you're unsure or a claim isn't standard, say so and reason from first principles instead of guessing.
Intuition + hook + flashcards for long-term memory.
Help me remember **Designing Google Maps — Tiles, Routing Tiles & ETA, Traced** for the long term: give the one-sentence intuition, a memorable hook/mnemonic, a tiny worked example, and 3 active-recall flashcards (Q -> A). If you're unsure or a claim isn't standard, say so and reason from first principles instead of guessing.