Designing a Metrics Monitoring & Alerting System, Traced
The system that has to stay up when everything else is down
A monitoring system has an unusual requirement: it is the thing you look at during an outage, so it must not share fate with the systems it watches. That single constraint explains several design choices that otherwise look paranoid — separate infrastructure, separate alerting path, and a willingness to lose precision rather than availability.
Scope
- Collect metrics from ~100,000 hosts/services; ~10 million time series.
- Retain 1 year, with detail near-term and coarse long-term.
- Query for dashboards (Grafana-style) and evaluate alert rules.
- Logs and distributed traces are different systems — metrics are small, numeric and regular; logs are large and unstructured; traces are per-request. Conflating them is the most common scoping error here.
The data model, and the number that sizes everything
A metric is a time series: a metric name plus a set of labels, mapping timestamps to numeric values
— e.g. http_requests_total{host="web-1", endpoint="/checkout", status="200"}.
Critically, every distinct label combination is its own series. That makes
cardinality, not request rate, the quantity that determines your cost and your failure mode. Ten
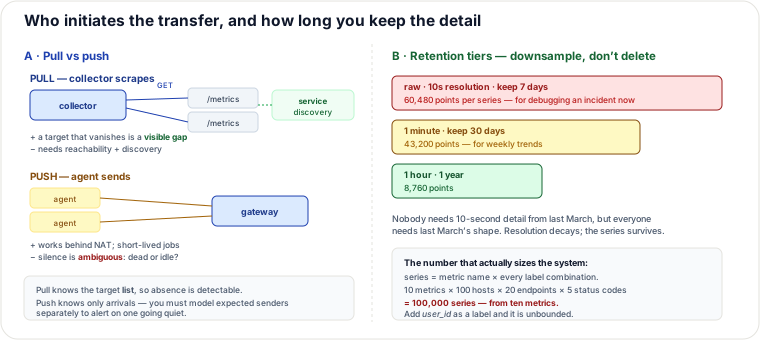
metrics across 100 hosts, 20 endpoints and 5 status codes is 10 × 100 × 20 × 5 =
100,000 series. Add one high-cardinality label such as user_id or a raw URL with IDs in it
and the count becomes effectively unbounded — the classic way teams take down their own monitoring. The rule worth
internalizing: labels are for dimensions you group by, never for identifiers.
Collection: pull or push
Pull — the collector periodically scrapes an HTTP endpoint (/metrics) on each
target, discovering the target list from service discovery. Because the collector holds the
expected list, a target that stops responding is an immediately detectable gap. It also means scrape timing is
centrally controlled, and anyone can curl the endpoint to debug.
Push — an agent on each host sends metrics to a gateway. This works where pull cannot reach: hosts behind NAT or firewalls, serverless functions, and short-lived batch jobs that finish before any scrape would occur.
The asymmetry that decides most architectures: with pull, silence is a signal; with push, silence is ambiguous. A push gateway that stops hearing from a host cannot distinguish a crashed host from one that is merely idle, unless you separately maintain a model of who should be reporting — which is the target list you avoided by choosing push. Most large deployments use pull as the default and push for the cases pull structurally cannot serve.
At scale, collectors are sharded — often by a consistent hash ring over targets, so each collector owns a slice and adding a collector moves only a fraction of targets. Collected samples are frequently written to a message queue (Kafka) rather than straight to the database: it absorbs write bursts, decouples ingestion from storage, and lets multiple consumers (the time-series store, the alerting evaluator, a long-term archive) read the same stream independently. This is the same buffering-and-fan-out argument as everywhere else, and here it also means a database hiccup does not lose the samples collected during it.
Storage: why a purpose-built time-series database
Time-series data has properties a general database does not exploit: writes are append-only and time-ordered, values within a series change little between samples, and queries are nearly always "this series over this range, aggregated." A TSDB exploits all three.
The compression is the interesting part, and it is dramatic. Timestamps arrive at regular intervals, so instead of storing each one, store the delta of the delta — with a fixed 10-second scrape, successive deltas are identical and the second-order delta is zero, which encodes in a bit or two. Values are compressed by XOR-ing against the previous value, since consecutive readings usually share most of their bits. Together (the approach popularized by Facebook's Gorilla) this routinely brings a 16-byte timestamp-plus-value pair down to a couple of bytes — an order-of-magnitude saving that is the reason storing millions of series is affordable at all.
Downsampling and retention do the rest. Keep raw resolution briefly for incident debugging, then roll up: 10-second data for 7 days, 1-minute for 30 days, 1-hour for a year. Note what this preserves and what it discards — you keep the shape of history forever and lose the ability to see a 20-second spike from last March. That is the right trade, but it must be a conscious one: a rollup that stores only averages destroys your ability to reason about tails later, so store min/max/count/sum per bucket, not just the mean. Averaged percentiles are mathematically meaningless, and this is where that mistake gets permanently baked in.
Query and alerting
The query service serves dashboards and rule evaluation. Two facts shape it: dashboard queries are highly repetitive (the same panels, every few seconds, from many people), so a cache layer in front of the TSDB removes most load for free; and wide queries can be brutal, since "P99 latency across all services for 30 days" touches an enormous number of points — which is exactly what the pre-computed rollups exist to answer cheaply.
The alerting path deserves to be its own component:
- Rules are configured as predicates over queries — e.g. error rate > 1% for 5 minutes.
- An evaluator runs each rule on a schedule against the TSDB.
- Firing alerts go to an alert manager, which deduplicates, groups and routes them.
- Notification channels: paging, chat, email, ticketing.
The alert manager is what separates a usable system from an ignored one. Without it, one failing database produces a hundred alerts (one per dependent service) and the humans learn to ignore the channel. Its jobs are grouping (collapse related alerts into one notification), inhibition (if the cluster is down, suppress the per-node alerts it causes), silencing (planned maintenance), and deduplication across evaluator replicas.
Two alerting design rules worth stating: use a duration condition ("for 5 minutes") so a single bad scrape does not page anyone; and prefer burn-rate alerting against an error budget over static thresholds, because a fixed "error rate > 1%" either pages constantly on a small service or never fires on a large one. (This guide's Observability & SRE topic covers burn-rate alerting in depth.)
Not sharing fate
The monitoring system must run on separate infrastructure from what it monitors — ideally a separate account, cluster and region — or the outage takes out your ability to see it. Two corollaries: the alerting notification path should not depend on your own services, and it is worth having a dead man's switch — an alert that fires when the monitoring system stops sending a regular heartbeat, because a silent monitoring system is indistinguishable from a healthy fleet.
Which approach, when
| Decision | Option | Choose when | Breaks when |
|---|---|---|---|
| Collection | Pull (scrape) | Long-lived services in a discoverable network | Targets behind NAT; jobs shorter than the scrape interval |
| Collection | Push (agent → gateway) | Serverless, batch jobs, restricted networks | You need to detect a missing sender — silence is ambiguous |
| Storage | TSDB with rollups | Any real metrics workload | You need arbitrary ad-hoc joins — that is a warehouse job |
| Storage | Relational database | Tiny scale, few series | Millions of series — no delta/XOR compression, index bloat |
| Retention | Tiered downsampling | Long history on a budget | Forensics needing per-second detail from months ago |
| Retention | Full-resolution forever | Regulated, narrow, high-value series | General fleet metrics — cost grows without bound |
| Alerting | Burn-rate on error budget | Services with an SLO | No SLO defined yet — nothing to burn against |
| Alerting | Static threshold + duration | Simple resource alerts (disk full) | Traffic varies widely — the threshold is wrong at some scale |
Pitfalls
- High-cardinality labels. Putting user IDs, request IDs, or raw URLs containing IDs into labels. The number one way monitoring systems fall over, and the damage is retroactive — the series already exist.
- Averaging percentiles during rollup. The average of P99s is not a P99; store the underlying distribution or a mergeable sketch instead.
- Monitoring running on the monitored infrastructure. Shared fate; you go blind exactly when it matters.
- No duration condition on rules, so a single failed scrape pages a human at 3am.
- No grouping or inhibition, producing alert storms that train people to ignore alerts — worse than having no alerts, because you believe you are covered.
- Alerting on causes instead of symptoms. Page on user-visible impact; make resource metrics diagnostic rather than paging.
- No dead man's switch. A broken collector looks exactly like a perfectly healthy fleet.
- Scrape interval shorter than the metric's meaning. Scraping a 1-minute-updated gauge every 5 seconds multiplies storage for no additional information.
Cost model — what dominates the bill
Metrics cost is series count × sample rate × retention, and cardinality is the term that actually varies by orders of magnitude between well- and badly-instrumented systems.
Rough BOTE: 10 million series scraped every 10 seconds is 10,000,000 / 10 = 1 million samples/second ingested. Uncompressed at 16 bytes per sample that is 16 MB/s ≈ 1.4 TB/day — clearly unaffordable to keep at full resolution. With delta-of-delta and XOR compression at roughly 2 bytes/sample, it becomes ~2 MB/s ≈ 170 GB/day. Seven days of raw retention is ~1.2 TB; the 1-minute tier for 30 days adds ~1/6 the sample rate over a longer window, and the hourly tier for a year is comparatively negligible. Total on the order of 2–3 TB including replication — a few hundred dollars a month of storage, which is remarkable for a year of history over ten million series.
That is the point: compression and downsampling move storage from the dominant cost to a minor one, at which point the bill shifts to ingest and query compute — the collectors, the queue, the write path, and the query fleet serving dashboards that auto-refresh every 10 seconds for every engineer.
Dominant line items: ingest/query compute; then retained storage; and, in managed offerings, per-series pricing — which makes cardinality the literal line item.
Levers: attack cardinality first (dropping one bad label can cut series count by 10× or more); lengthen scrape intervals for metrics that do not change fast; make retention tiers aggressive; and cache dashboard queries, since a handful of panels refreshing constantly can otherwise outweigh all rule evaluation combined.
Operability: the fingerprints of a broken monitoring system
The recursive problem here is that monitoring failures are hard to see with monitoring. Series count growing steadily with no new services deployed is a cardinality leak — a label picking up unbounded values — and it is the earliest and most actionable signal, because the alternative discovery method is the TSDB running out of memory. Ingest lag on the queue while collectors look healthy means the write path is the bottleneck, and because samples are buffered, dashboards go stale while everything reports fine.
Gaps in specific series but not others points at individual scrape failures — slow targets exceeding the scrape timeout, which is usually the monitored service being unhealthy and therefore precisely when you need the data. Query latency degrading only on long time ranges means rollups are missing or not being selected, so long queries are scanning raw data.
The most dangerous fingerprint is everything looking perfectly healthy, which is why the dead man's switch exists: a heartbeat alert that must fire if the pipeline stops. Watch also for alert volume rising while incident count is flat — the definition of alert fatigue, and a sign grouping/inhibition needs work rather than the thresholds; and rule evaluation duration approaching the evaluation interval, after which rules start being skipped and alerts silently stop firing.
Signals worth having: active series count with per-label-name attribution, ingest lag, scrape success rate and duration per target, rule-evaluation duration versus interval, notification delivery success, dead-man's-switch freshness, and alerts-per-incident as a fatigue measure.
Authored for this guide to cover the metrics monitoring & alerting design (Alex Xu Vol. 2, ch. 20 — not present in the Vol. 1 PDF); pull-vs-push and retention-tier diagram hand-authored as SVG. Complements this guide's Observability & SRE topic (burn-rate alerting, the cost of observability/cardinality, OpenTelemetry) and the "Design a Metrics/Log Pipeline" hands-on lab.
🤖 Don't fully get this? Learn it with Claude
Stuck on Designing a Metrics Monitoring & Alerting System, Traced? Open Claude, copy a block below, and it'll teach you this exact concept — visually and interactively.
Build the mental picture, not memorization.
I just read a lesson on **Designing a Metrics Monitoring & Alerting System, Traced** (System Design) and want to truly understand it. Explain Designing a Metrics Monitoring & Alerting System, Traced from first principles using ONE vivid real-world analogy and a visual mental model — draw it as ASCII art or a clear step-by-step diagram — with a concrete example using real numbers. Then ask me one question to check I got the mental picture, and wait for my reply. If you're unsure or a claim isn't standard, say so and reason from first principles instead of guessing.
Socratic — adapts to where you're stuck.
Teach me **Designing a Metrics Monitoring & Alerting System, Traced** interactively. Ask me ONE guiding question at a time, wait for my answer, and adapt to my confusion — build the idea with me step by step instead of explaining it all at once. If you're unsure or a claim isn't standard, say so and reason from first principles instead of guessing.
Active recall exposes what you missed.
Quiz me on **Designing a Metrics Monitoring & Alerting System, Traced** with 5 questions, easy to tricky, ONE at a time. Tell me if each answer is right; at the end, explain clearly what I got wrong and why. If you're unsure or a claim isn't standard, say so and reason from first principles instead of guessing.
Intuition + hook + flashcards for long-term memory.
Help me remember **Designing a Metrics Monitoring & Alerting System, Traced** for the long term: give the one-sentence intuition, a memorable hook/mnemonic, a tiny worked example, and 3 active-recall flashcards (Q -> A). If you're unsure or a claim isn't standard, say so and reason from first principles instead of guessing.