Performance Implications and Special Considerations
The one question service discovery has to answer cheaply
In a microservice fleet, instances come and go constantly — deploys, autoscaling, crashes — so their network addresses are not fixed. Service discovery fixes this by having each instance register its address (and keep a heartbeat alive) in a central registry, and having callers look up the live instances of the services they depend on before routing a request. The mechanism is trivial to state. The performance question is the whole game: how does a caller keep finding live instances without hammering the registry on every request, and without routing to an instance that died a moment ago?
Everything below follows from a single tension. Fresher discovery data means asking the registry more often (more load, and a registry outage takes everyone down); staler data means cheaper reads but a rising chance of sending traffic to a dead node. Every knob — poll interval, cache TTL, watch vs poll, health-check frequency — is a point on that freshness-versus-load curve. A senior engineer picks the point deliberately and can show the arithmetic.
Registry read load, traced
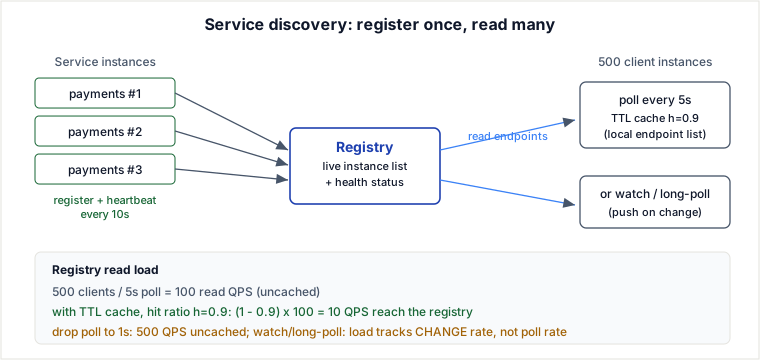
Start with the read side, because it is the load that scales with your fleet. Let M = number of client instances, T = poll interval in seconds, and S = number of distinct services each client calls (so it must look up S endpoint lists). If every client re-reads on a fixed timer, the steady-state registry read rate is:
registry read QPS = M × S / TTrace it with S = 1 for clarity. With M = 500 clients polling every T = 5s, that is 500 / 5 = 100 QPS hitting the registry forever, whether or not anything changed. Tighten the interval to T = 1s for fresher data and it jumps to 500 / 1 = 500 QPS — a 5× load increase bought purely to shave at most 4 seconds off staleness. If each client actually calls S = 4 services, multiply through: the 5s case is 500 × 4 / 5 = 400 QPS.
Now add a client-side TTL cache: each client caches the endpoint list and only re-reads the registry on a cache miss. If the cache serves a fraction h of lookups (hit ratio), the reads that actually reach the registry fall to (1 − h) of the uncached rate:
registry read QPS (cached) = (1 − h) × M × S / TAt h = 0.9, the 100 QPS case becomes (1 − 0.9) × 100 = 10 QPS — a 10× reduction in registry load for the cost of endpoint data that can now be up to one TTL stale. The table makes the freshness-versus-load trade explicit (M = 500, S = 1):
| Poll interval T | Reads / client / s | Uncached registry QPS | With TTL cache (h = 0.9) | Worst-case staleness |
|---|---|---|---|---|
| 10 s | 0.1 | 50 | 5 | up to 10 s |
| 5 s | 0.2 | 100 | 10 | up to 5 s |
| 1 s | 1.0 | 500 | 50 | up to 1 s |
Two things to read off it. First, load is linear in M and inversely linear in T — halving the interval doubles the load, with no diminishing returns to protect you. Second, the cache column and the staleness column move together: the cache does not make data fresher, it makes stale data cheap, so a high hit ratio is only safe if you also have a way to react when an endpoint dies (health checking and watches, below).
Watch / long-poll versus periodic polling
Polling has a structural inefficiency: its load is constant and proportional to the poll rate, even when nothing changes. A fleet whose membership is stable for an hour still pays the full 100 QPS for that hour. Worst-case staleness is one poll interval T, because a change that lands just after a client polls is invisible until its next tick.
A watch (or long-poll) inverts this. The client opens a long-lived request; the registry holds it open and responds only when the endpoint set actually changes, after which the client immediately re-establishes the watch. The consequences flip both metrics:
- Load tracks the change rate, not the poll rate. If membership changes a few times a minute, the registry pushes a few notifications per minute per interested client — regardless of how "fresh" clients want to be. Idle fleets cost almost nothing.
- Staleness approaches zero. A change propagates in roughly one network round-trip plus the registry's fan-out time, not up to
T.
The cost is the mirror image: the registry must hold one open connection per watching client (memory and file descriptors scale with M, not with request rate), and it must fan out each change to every watcher — a burst of work concentrated at change time. By Little's Law (L = λW) the registry's held-connection count is not driven by request rate at all: each watcher holds its connection for effectively unbounded W (arrival rate ≈ 0 once established), so the standing population is simply M — which is why watch capacity is sized in file descriptors and memory, not QPS. This is exactly why etcd, Consul, and ZooKeeper offer watch APIs, and why Kubernetes' API server is built around watches with resourceVersion rather than having every kubelet poll.
| Property | Periodic polling | Watch / long-poll |
|---|---|---|
| Registry load scales with | Poll rate (M × S / T), constant | Change rate (near-zero when idle) |
| Worst-case staleness | Up to one interval T | ~one round-trip (near-real-time) |
| Registry resource cost | CPU per request; no held state | One open connection per watcher (fds, memory) |
| Failure behavior | Self-healing; next poll just retries | Dropped watch must be re-established (and can miss events without a resync/version) |
| Best when | Small fleet, stable membership, simple clients | Large fleet, frequent changes, low-staleness requirement |
Health-check frequency versus detection latency
A registry entry is only useful if it is removed promptly when the instance dies — otherwise the cache serves a live-looking address that black-holes traffic. Liveness is established by health checks (or heartbeats): the registry (or a checker) probes each instance every H seconds and marks it down after N consecutive misses. The detection latency is bounded by:
time to detect a dead instance ≈ H × N (+ propagation to caches)With H = 1s and a threshold of N = 3 misses, a crashed instance is declared dead in up to about 3 seconds — plus the time for that removal to reach clients (immediate under watches; up to a TTL under caching). Shortening H cuts detection latency linearly but raises check load linearly: probing P targets every H seconds is P / H checks per second, so halving H doubles the probe traffic and the CPU spent scoring health. The threshold N exists to trade detection speed for false-positive resistance: N = 1 reacts fastest but evicts a healthy instance on a single blipped packet; a larger N rides out transient blips at the cost of slower detection. There is no free setting — fast, cheap, and flap-resistant is a pick-two.
Client-side versus server-side discovery
Where the lookup-and-choose logic lives is the other structural decision, and it moves the performance and coupling costs to different places.
- Client-side discovery — the client queries the registry itself, holds the instance list, and load-balances across it in-process (Netflix Eureka + Ribbon is the classic example). There is no extra network hop, so latency is minimal, and the client can make smart, locality-aware balancing choices. The cost is coupling: every client needs registry-aware library code, in every language you deploy, and the registry sees load from every client directly (the
M × S / Tabove is its problem). - Server-side discovery — the client sends to a stable virtual address (a load balancer, API gateway, or the sidecar/control-plane of a service mesh), and that component does the registry lookup and balancing. Clients stay dumb and language-agnostic, and registry access is concentrated in a few well-behaved components you can cache and scale independently. The cost is an extra network hop on every request (added latency) and a new tier you must make highly available — if the router is down, discovery is down.
The industry has largely moved the smarts into a service mesh sidecar (Envoy/Istio, Linkerd): architecturally it is server-side discovery — the app talks to localhost — but the hop is to a co-located proxy (sub-millisecond, no extra network round-trip across hosts), and the control plane pushes endpoint updates to sidecars via watch-style streaming rather than each app polling. That is deliberately the best of both: client-side latency locality with server-side decoupling.
Pitfalls a working engineer hits
- Aggressive polling overload. The
M × S / Tformula bites hardest as the fleet grows: a 1s poll that was fine at 50 clients is 10× the load at 500. Symptoms are a registry pegged on CPU serving reads that almost always return the same answer. Fix with a TTL cache and a longer interval, or move to watches. - Thundering herd on failover. When the registry restarts or a node fails over, every client's connection drops at once, and they all reconnect and re-read in the same instant — a synchronized spike that can knock the recovering registry straight back over. This is the most dangerous discovery failure because it hits exactly when the system is weakest. Mitigate with jittered exponential backoff on reconnect (randomize each client's retry delay so the load spreads over a window instead of arriving as one wall), and cap concurrent re-reads.
- Stale cache routing to dead instances. A high cache hit ratio is load-cheap but means a client can hold an address that died seconds ago and keep sending it traffic until the TTL expires. The defense is not "never cache" — it is to pair caching with fast health-based eviction and client-side retry-on-another-instance, so a stale entry costs one failed attempt, not a sustained outage.
- Health-check interval versus detection lag. Set
Htoo high and dead nodes linger in the registry for tens of seconds (traffic keeps black-holing); set it too low and health-check traffic itself becomes a load problem and healthy nodes flap on transient blips. TuneHandNto your real crash-to-eviction budget, not to a default.
Selection and trade-offs
The discovery layer is a set of coupled choices; here is how a senior engineer decides each, against a named alternative.
- Watch/long-poll vs polling vs TTL cache. Use polling when the fleet is small and membership is stable — its constant load is trivial and its self-healing simplicity (a dropped poll just retries) is worth more than freshness. Add a TTL cache on top the moment read QPS becomes visible on the registry: it cuts load by
(1 − h)×for the price of bounded staleness, and is the cheapest first move. Move to watches when the fleet is large or changes are frequent and you need low staleness: load then tracks the change rate instead of the fleet size, at the cost of per-watcher connection state on the registry and re-sync logic on drop. The rule of thumb: polling+cache for reads that tolerate seconds of staleness; watches when seconds of staleness cause user-visible failures. - Client-side vs server-side discovery. Choose client-side when you control the clients, run few languages, and want the lowest possible latency (no extra hop) and smart in-process balancing — accepting a fat, registry-aware client library everywhere. Choose server-side (LB / gateway / mesh sidecar) when clients are heterogeneous or third-party, or when you want registry access concentrated and clients dumb — accepting an extra hop and a router tier you must keep highly available. The modern default for large polyglot fleets is a service mesh sidecar: it keeps clients dumb (server-side decoupling) while the hop is only to localhost (client-side latency), with the control plane pushing updates via watches.
Takeaways
- Registry read load is
M × S / Tand scales linearly with the fleet — a TTL cache with hit ratiohcuts it to(1 − h)×, trading load for up to one TTL of staleness. - Polling costs the poll rate constantly and is at most
Tstale; a watch costs the change rate and is near-real-time but needs per-watcher connection state and re-sync on drop. - Detection latency is roughly
H × N— shorter checks find dead nodes faster but multiply probe load and risk flapping; caching then adds its own TTL before the eviction reaches clients. - The recurring failure is a synchronized re-read after failover; jittered backoff is the standard defense, and client-side retry-on-another-instance makes a stale cache entry survivable.
Sources: Sam Newman, Building Microservices (2nd ed.) — registries, client- vs server-side discovery; Consul, etcd, and Apache ZooKeeper documentation — watch APIs and health checking; Kubernetes API concepts — watch + resourceVersion and Endpoints/EndpointSlice; Netflix Eureka and Ribbon (client-side discovery); Istio / Envoy and Linkerd docs — service-mesh sidecar discovery; Google SRE Book — jittered backoff and thundering-herd avoidance. Little's Law from queueing theory for cache/load reasoning. Re-authored and deepened for this guide.
🤖 Don't fully get this? Learn it with Claude
Stuck on Performance Implications and Special Considerations? Open Claude, copy a block below, and it'll teach you this exact concept — visually and interactively.
Build the mental picture, not memorization.
I just read a lesson on **Performance Implications and Special Considerations** (System Design) and want to truly understand it. Explain Performance Implications and Special Considerations from first principles using ONE vivid real-world analogy and a visual mental model — draw it as ASCII art or a clear step-by-step diagram — with a concrete example using real numbers. Then ask me one question to check I got the mental picture, and wait for my reply. If you're unsure or a claim isn't standard, say so and reason from first principles instead of guessing.
Socratic — adapts to where you're stuck.
Teach me **Performance Implications and Special Considerations** interactively. Ask me ONE guiding question at a time, wait for my answer, and adapt to my confusion — build the idea with me step by step instead of explaining it all at once. If you're unsure or a claim isn't standard, say so and reason from first principles instead of guessing.
Active recall exposes what you missed.
Quiz me on **Performance Implications and Special Considerations** with 5 questions, easy to tricky, ONE at a time. Tell me if each answer is right; at the end, explain clearly what I got wrong and why. If you're unsure or a claim isn't standard, say so and reason from first principles instead of guessing.
Intuition + hook + flashcards for long-term memory.
Help me remember **Performance Implications and Special Considerations** for the long term: give the one-sentence intuition, a memorable hook/mnemonic, a tiny worked example, and 3 active-recall flashcards (Q -> A). If you're unsure or a claim isn't standard, say so and reason from first principles instead of guessing.