How Can I do Back-of-the-Envelope Sizing for QPS, Bandwidth, Storage, and Peak vs
Back-of-the-envelope sizing in one page
Back-of-the-envelope (BOTE) sizing is the art of turning a one-line product description into rough numbers for how much traffic, network throughput, and storage a system needs — using nothing but mental arithmetic. It is the first thing an interviewer expects in a system-design round, and the first sanity check a real engineer runs before provisioning anything.
Queries per second (QPS) measures how many requests a system handles each second. Bandwidth (bytes/second) is the network capacity to move those requests in and out. Storage is how much data accumulates over time.
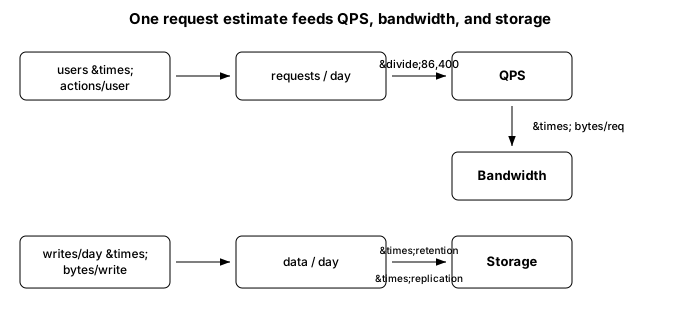
All three fall out of a single estimate — "how many requests per day, and how big is each one" — plus two constants worth memorizing: a day is 86,400 seconds (round to ~100,000 for mental math), and each step up the KB → MB → GB → TB → PB ladder multiplies by ~1,000.
The QPS recipe
- Total requests/day = daily active users × actions per user.
- Average QPS = requests/day ÷ 86,400 s.
- Split reads and writes using the read:write ratio — most systems are read-heavy, so a single blended number hides the real load.
- Peak QPS = average QPS × a peak multiplier (typically 2–3×).
Micro-example: a service with 1 million writes/day and a 100:1 read:write ratio handles ~12 write QPS (1,000,000 ÷ 86,400) and ~1,200 read QPS. Round up — quote ~1,200 QPS — so the estimate stays conservative.
Why 1M daily users is not 1M QPS
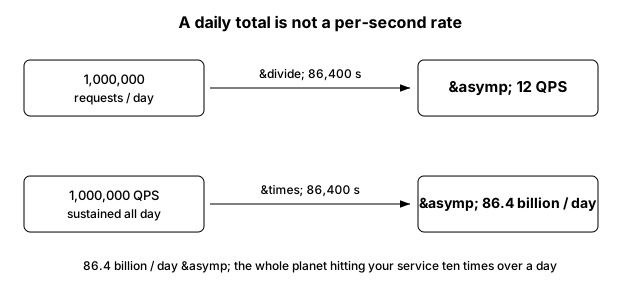
The most common BOTE mistake is reading a daily total as a per-second rate. "One million users, each doing one thing" is not one million QPS — it is one million requests spread across all 86,400 seconds of the day, which averages to about 12 QPS.
To feel how far apart those numbers are, run it backwards. Sustaining 1M QPS every second, all day would mean about 86 billion requests per day — roughly the entire planet hitting your service ten times over the course of a day. Almost no consumer product on Earth does that. So whenever a "per second" figure feels enormous, check whether you accidentally skipped the ÷ 86,400 step.
Estimating bandwidth
Once you have QPS, bandwidth is one multiplication away.
- Estimate the average request/response size in bytes.
- Bandwidth ≈ QPS × bytes per request. Example: 1 KB responses at 1,000 QPS ≈ 1 MB/s.
- Cross-check via the daily route: Bandwidth ≈ total bytes/day ÷ 86,400.
For instance, 100 million reads/day at ~1 KB each is ~100 GB/day; dividing by 86,400 s gives ~1 MB/s. That is the sustained figure — double or triple it to absorb bursts and larger-than-average payloads. One unit trap: network links are rated in bits per second, so multiply bytes by 8 before comparing against a link — ~1 MB/s is ~8 Mb/s.
Estimating storage
- Data/day = writes/day × bytes per write.
- Total stored = data/day × retention (days or years).
- Multiply by replication (e.g. 3×) and add overhead for indexes, metadata, and logs.
Example: 1 million writes/day at 1 KB each ≈ 1 GB/day → ~365 GB/year → ~3.65 TB over a decade; round to ~4 TB once indexes and logs are included. A heavier workload — 1 million users each producing 100 KB/day — is ~100 GB/day, or ~36 TB/year. These ballparks decide whether a single node suffices now and when sharding becomes unavoidable.
Peak vs. average load
Traffic is never uniform, so peak load can dwarf the average. Size average QPS, bandwidth, and storage first, then choose a peak multiplier from usage patterns or history — 2× is a common default, but if analytics show 5 PM runs 3× normal, use 3×. Design capacity (or autoscaling) for the peak, and always state the assumption out loud so reviewers can judge your safety margin.
Example: a service averaging ~3,500 QPS but expecting a 2× peak should be provisioned for ~7,000 QPS.
Worked example: a social news feed
Consider a feed that takes 300 million posts/day (150 million users × 2 posts each) as writes, with a 100:1 read:write ratio — so ~30 billion feed reads/day. Assume a 2× peak, 10% of posts carry a 1 MB image, a text post is ~1 KB, and read responses average ~50 KB. Every row below uses the same recipe: divide daily totals by 86,400 seconds, then apply the peak and size multipliers.
| Quantity | Calculation | Result |
|---|---|---|
| Avg write QPS | 300M ÷ 86,400 s | ~3,500 QPS |
| Avg read QPS | 30B ÷ 86,400 s | ~350,000 QPS |
| Peak write QPS | 3,500 × 2 | ~7,000 QPS |
| Media written/day | 300M × 10% × 1 MB | ~30 TB/day |
| Media over 5 years | 30 TB × 365 × 5 | ~55 PB |
| Peak text ingestion | 7,000 QPS × 1 KB | ~7 MB/s |
| Peak media ingestion | 30 TB/day ÷ 86,400 s ≈ 350 MB/s avg, × 2 | ~700 MB/s |
Note which operand belongs to which path: the 50 KB response size prices the read/egress path (350,000 QPS × 50 KB ≈ 17.5 GB/s average, ~35 GB/s at the 2× peak — the number that justifies the CDN), while ingestion is priced by write payloads, and here the media dominates text by ~100×.
Then choose a redundancy model, and state it: large media blobs are normally stored with erasure coding (~1.4× overhead), not 3× replication, so the ~55 PB of raw media plus metadata lands near 75 PB of provisioned capacity — whereas replicating it 3× like the transactional store would demand ~165 PB. That fork is exactly the order-of-magnitude decision a sizing pass exists to surface. Notice the payoff of splitting reads from writes: the read path is ~100× the write path, so the two demand completely different scaling strategies — caching and CDNs for reads, durable sharded storage for writes.
Key takeaways
- Memorize the constants: 86,400 s/day (≈100,000 for mental math) and the KB → MB → GB → TB → PB ladder.
- A daily total is not a per-second rate — always divide by ~86,400 before quoting QPS.
- Split reads from writes; read-heavy systems hide their real load behind a blended number.
- Size for the peak, not the average, and state your peak multiplier explicitly.
- Round up and write down every assumption (users, actions, sizes, retention, replication) so the estimate is auditable.
Source
Adapted and expanded from DesignGurus, "Back-of-the-Envelope Estimation in a System Design Interview", with supporting notes on CDN sizing from DesignGurus, "Content Delivery Network (CDN) System Design Basics."
🤖 Don't fully get this? Learn it with Claude
Stuck on How Can I do Back-of-the-Envelope Sizing for QPS, Bandwidth, Storage, and Peak vs? Open Claude, copy a block below, and it'll teach you this exact concept — visually and interactively.
Build the mental picture, not memorization.
I just read a lesson on **How Can I do Back-of-the-Envelope Sizing for QPS, Bandwidth, Storage, and Peak vs** (System Design) and want to truly understand it. Explain How Can I do Back-of-the-Envelope Sizing for QPS, Bandwidth, Storage, and Peak vs from first principles using ONE vivid real-world analogy and a visual mental model — draw it as ASCII art or a clear step-by-step diagram — with a concrete example using real numbers. Then ask me one question to check I got the mental picture, and wait for my reply. If you're unsure or a claim isn't standard, say so and reason from first principles instead of guessing.
Socratic — adapts to where you're stuck.
Teach me **How Can I do Back-of-the-Envelope Sizing for QPS, Bandwidth, Storage, and Peak vs** interactively. Ask me ONE guiding question at a time, wait for my answer, and adapt to my confusion — build the idea with me step by step instead of explaining it all at once. If you're unsure or a claim isn't standard, say so and reason from first principles instead of guessing.
Active recall exposes what you missed.
Quiz me on **How Can I do Back-of-the-Envelope Sizing for QPS, Bandwidth, Storage, and Peak vs** with 5 questions, easy to tricky, ONE at a time. Tell me if each answer is right; at the end, explain clearly what I got wrong and why. If you're unsure or a claim isn't standard, say so and reason from first principles instead of guessing.
Intuition + hook + flashcards for long-term memory.
Help me remember **How Can I do Back-of-the-Envelope Sizing for QPS, Bandwidth, Storage, and Peak vs** for the long term: give the one-sentence intuition, a memorable hook/mnemonic, a tiny worked example, and 3 active-recall flashcards (Q -> A). If you're unsure or a claim isn't standard, say so and reason from first principles instead of guessing.