What Is Opentelemetry, And How Do Traces, Spans, Metrics, And Logs Fit Together
OpenTelemetry works by threading one 128-bit trace ID through every service a request touches — propagated in-band via a standard HTTP header (W3C traceparent) — so that spans emitted independently by a dozen processes can be stitched back into a single causal graph, and so metrics and logs can carry that same ID and become clickable links into the trace that produced them. Everything else (the SDKs, the Collector, the exporters) exists to generate, correlate, sample, and ship that data without binding you to one vendor's backend.
OTel is a CNCF project formed in 2019 by merging OpenTracing (a tracing API standard) and OpenCensus (Google's instrumentation libraries). Tracing and metrics stabilized first; the logs signal reached stability later (the log data model and OTLP log support landed around 2023), which is why many stacks still ship logs through older pipelines and only correlate them with OTel trace IDs.
The three signals, precisely
The "three pillars" is a useful slogan but a slightly misleading one — the real power is not three separate stores, it is one correlation key (trace ID) shared across all three. Each signal answers a different question:
| Signal | Shape | Answers | Cost profile |
|---|---|---|---|
| Metrics | Pre-aggregated time series (counter, gauge, histogram) | What changed, and how much (rate, ratio, percentile) | Cheap per data point; cost scales with label cardinality, not traffic |
| Traces | A DAG of spans sharing a trace ID | Where in the call graph, and how long each hop took | Expensive per request; controlled by sampling |
| Logs | Timestamped, severity-tagged event records | Why — the exact exception/state at a moment | Highest raw volume; controlled by level + retention |
A span is one operation: a name, a start and end timestamp, a SpanKind (SERVER, CLIENT, INTERNAL, PRODUCER, CONSUMER), a status, and key/value attributes (e.g. http.route, db.system). Every span carries a SpanContext: the shared trace_id, its own span_id, and a parent_span_id pointing at the span that caused it. Follow the parent pointers and you get the DAG — no central coordinator assembles it; the parent IDs are the graph.
The mechanism: context propagation across a service boundary
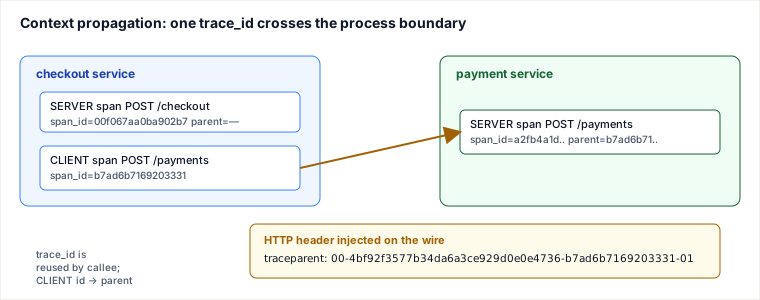
The hard problem in distributed tracing is not recording a span — it is making a span emitted by the payment service know it is a child of a span emitted by the checkout service, when the two share nothing but a network socket. OTel solves this with context propagation using the W3C Trace Context standard. When one service calls another over HTTP, the caller's SDK injects a header:
traceparent: 00-4bf92f3577b34da6a3ce929d0e0e4736-b7ad6b7169203331-01
              │  └──────── trace-id (16B) ────────┘ └ parent-id ┘  └ flags
 version(00)                                        (caller span)   sampled=1
The four fields are: version (00), the 16-byte trace-id, the 8-byte parent-id (the caller's current span_id), and 1 byte of trace-flags whose low bit is the sampled decision. A companion tracestate header carries vendor-specific key/values (e.g. sampling priority) without breaking the standard.
On the receiving side the SDK extracts that header, then starts a new SERVER span that reuses the same trace_id and sets its parent_span_id to the incoming parent-id. That single move — reuse trace_id, adopt parent-id as parent — is the entire trick that turns N independent processes into one trace.
A real trace, span by span
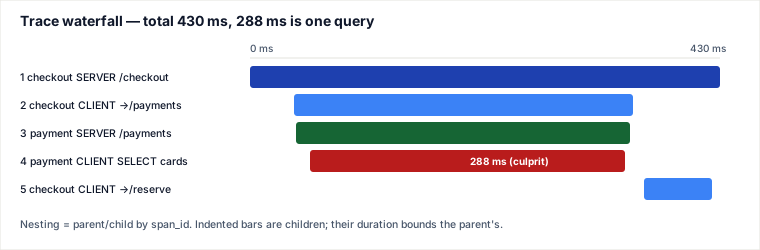
Here is one actual checkout request that ran slow. All spans share trace_id=4bf92f3577b34da6a3ce929d0e0e4736; times are milliseconds relative to the root's start. Read the parent column to reconstruct the tree, and the start/dur columns to see where the 430 ms went.
| # | span_id | parent | service · kind | operation | start | dur |
|---|---|---|---|---|---|---|
| 1 | 00f067aa…902b7 | — | checkout · SERVER | POST /checkout | 0 | 430 |
| 2 | b7ad6b71…3331 | 00f067aa… | checkout · CLIENT | POST /payments | 40 | 310 |
| 3 | a2fb4a1d…d312 | b7ad6b71… | payment · SERVER | POST /payments | 42 | 305 |
| 4 | c31d8f04…7a9e | a2fb4a1d… | payment · CLIENT | SELECT cards WHERE… | 55 | 288 |
| 5 | d90ac112…44f1 | 00f067aa… | checkout · CLIENT | POST /reserve-stock | 360 | 62 |
The chain 1→2→3→4 reads: checkout's HTTP call (span 2, 310 ms) is almost entirely consumed by the payment service (span 3, 305 ms), which in turn is almost entirely one database query (span 4, 288 ms). The network hop and inventory call are noise. Span 4's attributes (db.system=postgresql, db.statement) name the query, and because the SDK attached the trace_id to that service's logs, you can jump straight to the log line DatabaseTimeout: connection pool exhausted (trace_id=4bf92f35…) emitted at t≈340. That is the metric→trace→log path collapsed into three clicks.
Sampling: the cost lever
Recording every span of every request is unaffordable at scale (a busy service can emit millions of spans/second, and backends bill per span). Sampling decides which traces to keep. Two families:
- Head sampling — the keep/drop decision is made at the root, before you know what happens, and rides along in the
traceparentflags bit so every downstream service honors it. Cheap, stateless, predictable volume. The catch: it is a coin flip made before the error occurs, so a 1% sample will drop 99% of your rare failures. Use parent-based sampling so a child never keeps a span whose parent was dropped (otherwise you get orphan spans and broken traces). - Tail sampling — buffer all spans of a trace, wait until the trace completes, then decide based on the whole thing: "keep if any span errored OR total latency > 500 ms, else sample 5%." You keep exactly the interesting traces. The cost: the Collector must hold every span of an in-flight trace in memory, and all spans of a given trace must reach the same Collector instance — which forces a
loadbalancingexporter keyed on trace_id in front of the tail-sampling tier.
Exemplars bridge sampling back to metrics: a histogram bucket (say, the p99 latency bucket) can attach an exemplar — a recorded value plus the trace_id of one request that landed in that bucket. In Grafana you click the dot on the latency chart and land on an actual slow trace. This is how you keep metrics cheap (aggregated) yet still reach a representative trace without full trace retention.
The Collector: the pipeline in the middle
SDKs export via OTLP (OpenTelemetry Protocol, gRPC/HTTP) to the Collector — a standalone process that decouples your app from your backend. Its config is three stages wired into pipelines:
- Receivers ingest data (OTLP, plus Jaeger, Zipkin, Prometheus scrape, Kafka…). One Collector can accept many formats.
- Processors transform in flight:
memory_limiter(drop before OOM),batch(coalesce exports — never export unbatched at volume),tail_sampling,attributes/redaction(strip PII),resourcedetection(tag with k8s pod/region). - Exporters ship out (OTLP to a vendor, Prometheus remote-write, S3…). One pipeline can fan out to several backends — that is the concrete mechanism of "no vendor lock-in."
Two deployment shapes: agent (a sidecar or DaemonSet next to every app — offloads batching/retry from the SDK, low latency) and gateway (a standalone Collector cluster all agents forward to — the right place for tail sampling, cost control, and central redaction). Real deployments run both: agent for collection, gateway for policy.
Pitfalls a working engineer hits
- Broken traces at async boundaries. Context lives in a thread-local / async-local. Hand work to a raw thread pool, a background job, or a message queue and the context is not automatically carried — you get two disconnected traces. Fix: explicitly inject the propagation context into the queue message (PRODUCER span) and extract it on the consumer (CONSUMER span).
- Mixed propagators. A service using W3C
traceparentcalling one that only reads Zipkin'sB3headers produces orphan spans — same request, two trace IDs. Configure a composite propagator, or standardize on W3C fleet-wide. - Sampling mismatch. Independent per-service sampling (not parent-based) keeps a child while dropping its parent → gaps in the waterfall. Always propagate the decision.
- Metric cardinality explosion. Putting
user_id,request_id, or a raw URL with IDs as a metric attribute creates a new time series per value. This is the #1 way to melt Prometheus. Use bounded labels (http.route, nothttp.target); high-cardinality context belongs on spans, not metrics. - Clock skew. Span start/end use each host's wall clock. Unsynced hosts produce negative durations or a child that appears to start before its parent. NTP discipline matters for trace fidelity.
- No
batch/memory_limiter. Exporting each span individually or buffering unbounded under a traffic spike either saturates the network or OOMs the Collector.
When to use it — and when not
Reach for OpenTelemetry SDK + Collector when: you run polyglot microservices, want to switch or dual-ship to multiple observability backends, need to strip PII centrally, or refuse vendor lock-in on the wire format. OTLP + Collector means your instrumentation outlives any single vendor contract.
Trade-offs vs a proprietary vendor agent (e.g. Datadog / New Relic APM libraries): the vendor agent typically gives richer zero-config auto-instrumentation, deeper language-runtime hooks, and turnkey dashboards — you gain speed-to-value and lose portability (its wire format and code are theirs; migrating means re-instrumenting). OTel gives portability and a shared standard, and costs you more setup, config surface (the Collector is a system to run and tune), and uneven auto-instrumentation maturity across languages. Choose OTel when portability and multi-backend outweigh convenience; choose the vendor agent when you are committed to one platform and want the deepest, lowest-effort integration.
Head vs tail sampling: choose head sampling when you need predictable ingest volume and stateless simplicity and can tolerate losing rare errors; choose tail sampling when catching every error/slow trace matters more than infra cost, and you can run the stateful, trace-affinity-routed gateway tier it requires.
Agent vs gateway Collector: agent-only is fine for small fleets; add a gateway once you need central tail sampling, cost governance, or redaction. Do NOT bother with full distributed tracing at all when you run a single monolith with no fan-out — a well-instrumented metrics + structured-logs setup answers most questions there, and traces add instrumentation cost with little topological payoff. Tracing earns its keep exactly when a request crosses process boundaries.
Takeaways
- The whole system rests on one move: propagate a shared trace_id in-band (W3C
traceparent) and set each new span'sparent_idto the caller's span_id. Parent pointers are the DAG. - Signals differ by cost lever: metrics scale with cardinality, traces with sampling, logs with volume/retention. Correlate all three by trace_id; keep high-cardinality context on spans, not metric labels.
- Head sampling is cheap and stateless but drops rare failures; tail sampling keeps errors and slow traces but needs a stateful, trace-affinity gateway. Exemplars link metric buckets to real traces without full retention.
- The Collector (receivers → processors → exporters) is where portability, batching, sampling, and PII redaction actually happen — and why OTel avoids vendor lock-in.
Re-authored and deepened for this guide. Sources: OpenTelemetry documentation (concepts: signals, context propagation, sampling, the Collector; opentelemetry.io); W3C Trace Context Recommendation (traceparent/tracestate header format); the CNCF OpenTracing + OpenCensus merger announcement (2019) and the OpenTelemetry logs stability milestones; Prometheus/OpenMetrics exemplars specification; and standard distributed-tracing practice as described in Google's Dapper paper and Cindy Sridharan's Distributed Systems Observability. Span IDs, timings, and the traceparent value shown are illustrative but conform to the real 16-byte trace-id / 8-byte span-id / W3C header formats.
🤖 Don't fully get this? Learn it with Claude
Stuck on What Is Opentelemetry, And How Do Traces, Spans, Metrics, And Logs Fit Together? Open Claude, copy a block below, and it'll teach you this exact concept — visually and interactively.
Build the mental picture, not memorization.
I just read a lesson on **What Is Opentelemetry, And How Do Traces, Spans, Metrics, And Logs Fit Together** (System Design) and want to truly understand it. Explain What Is Opentelemetry, And How Do Traces, Spans, Metrics, And Logs Fit Together from first principles using ONE vivid real-world analogy and a visual mental model — draw it as ASCII art or a clear step-by-step diagram — with a concrete example using real numbers. Then ask me one question to check I got the mental picture, and wait for my reply. If you're unsure or a claim isn't standard, say so and reason from first principles instead of guessing.
Socratic — adapts to where you're stuck.
Teach me **What Is Opentelemetry, And How Do Traces, Spans, Metrics, And Logs Fit Together** interactively. Ask me ONE guiding question at a time, wait for my answer, and adapt to my confusion — build the idea with me step by step instead of explaining it all at once. If you're unsure or a claim isn't standard, say so and reason from first principles instead of guessing.
Active recall exposes what you missed.
Quiz me on **What Is Opentelemetry, And How Do Traces, Spans, Metrics, And Logs Fit Together** with 5 questions, easy to tricky, ONE at a time. Tell me if each answer is right; at the end, explain clearly what I got wrong and why. If you're unsure or a claim isn't standard, say so and reason from first principles instead of guessing.
Intuition + hook + flashcards for long-term memory.
Help me remember **What Is Opentelemetry, And How Do Traces, Spans, Metrics, And Logs Fit Together** for the long term: give the one-sentence intuition, a memorable hook/mnemonic, a tiny worked example, and 3 active-recall flashcards (Q -> A). If you're unsure or a claim isn't standard, say so and reason from first principles instead of guessing.