Best, Worst, and Average Cases
Best, Worst, and Average Cases
Two algorithms can both be "linear search" and yet finish in wildly different amounts of time on the same-sized input. If the item you want happens to sit at the front of the array, you find it on the first comparison. If it sits at the very end (or isn't there at all), you scan every element. Same algorithm, same input size n — different amount of work. The case analysis is how we name and reason about that spread instead of pretending an algorithm has a single fixed cost.
The key idea: fix the input size n, then look across all possible inputs of that size. The number of basic operations varies over that set. The best case is the luckiest input, the worst case is the unluckiest, and the average case is what you'd expect over a realistic distribution of inputs. These are three different questions about the same algorithm — not three different algorithms.
Precise definitions
Let T(x) be the number of basic operations the algorithm performs on a specific input x, and let Sn be the set of all inputs of size n. Then:
- Best case:
B(n) = minx∈Sn T(x)— the fewest operations over all inputs of sizen. - Worst case:
W(n) = maxx∈Sn T(x)— the most operations over all inputs of sizen. - Average case:
A(n) = Σx∈Sn Pr(x)·T(x)— the expected operations, weighted by how likely each input is.
Two things people constantly conflate. First, case (which input?) is independent of asymptotic notation (how does cost grow?). You can put a tight Θ, an upper O, or a lower Ω bound on any of the three curves. "Worst case O(n2)" and "average case Θ(n log n)" are both legitimate, and describe different curves. Second, the average case requires an explicit probability model of the inputs. Without stating that assumption, "average" is meaningless — the number depends entirely on what you assume the inputs look like.
Worked example: linear search, operations counted
Search an array of n = 8 elements for a target, counting each comparison as one operation. Scan left to right; stop when found.
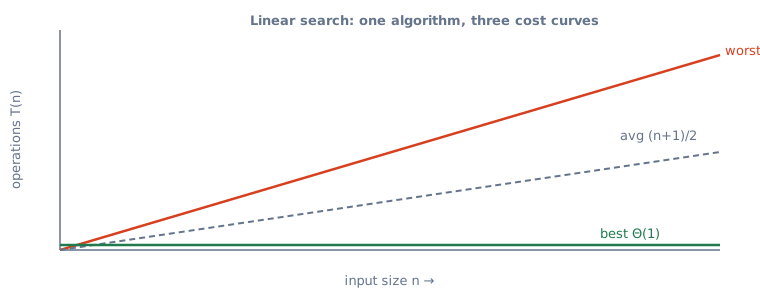
- Best case: target is at index 0. We do 1 comparison and return.
B(n) = 1→ Θ(1), independent ofn. - Worst case: target is at index 7, or absent entirely. We do 8 comparisons.
W(n) = n→ Θ(n). - Average case (successful search, target equally likely at any index): if it's at index
i(0-based) we doi+1comparisons. Average =(1+2+3+4+5+6+7+8)/8 = 36/8 = 4.5comparisons. In generalA(n) = (1+2+…+n)/n = (n+1)/2→ Θ(n).
Notice the average is not the midpoint between best and worst in any deep sense — it fell out of a specific assumption (uniform position, guaranteed present). Change the model — say the target is absent 90% of the time — and the average slides toward n. That's the whole point: the average case is a claim about your data, not just your code.
Pitfalls and what an interviewer probes
- Confusing worst case with big-O. Big-O is just an upper bound on a function; it can bound the best case too. Saying "the worst case is O(n)" is loose — the worst case is a curve, and O/Ω/Θ describe it. Interviewers listen for you saying Θ when you mean a tight bound.
- Quoting an average with no distribution. "Quicksort is O(n log n) on average" is only true assuming random pivots / randomly-ordered input. State the assumption. On already-sorted input with a naive first-element pivot, quicksort degrades to Θ(n2).
- Assuming best case is achievable in practice. Best case is often a degenerate lucky input you'll almost never see; it rarely guides engineering decisions. Its main use is honesty ("this can't do better than Ω(n) because it must read all input").
- Ignoring amortized vs average. These differ. Amortized cost is a worst-case guarantee spread over a sequence of operations (e.g. dynamic-array push is amortized Θ(1) with no probability involved). Average cost is a probabilistic expectation over inputs. Interviewers love catching this mix-up.
When it matters in practice, and trade-offs
Which case you optimize for depends on the stakes of a slow run:
- Worst case dominates when tail latency hurts. Real-time systems, databases serving SLAs, adversarial settings (a user who crafts pathological input to DoS you). Here a guaranteed Θ(n log n) merge sort or heapsort beats quicksort's better average but ugly Θ(n2) worst case. Hash tables are Θ(1) average but Θ(n) worst — fine for a cache, dangerous where an attacker controls keys.
- Average case dominates for throughput over many runs. Batch jobs, offline analytics. Quicksort is the standard library sort's core precisely because its average constant factors beat merge sort, and randomization makes the worst case astronomically unlikely rather than impossible.
- Best case is mostly a sanity floor. It tells you the unavoidable minimum — e.g. any comparison sort needs Ω(n) just to touch every element, and Ω(n log n) comparisons in the worst case by the decision-tree bound. Useful for proving "you cannot do better than this," not for picking algorithms.
The engineering move is to match the case to the risk: if a bad input is rare and cheap, optimize the average; if a bad input is catastrophic or attacker-triggerable, pay for a good worst case even at some average-case cost.
Key takeaways
- Fix
n, vary the input: best = luckiest input (min ops), worst = unluckiest (max ops), average = expected ops under an explicit probability model. - Case ≠ notation: O/Ω/Θ can each bound any of the three curves; prefer Θ when you mean a tight bound, and never quote an average without stating the input distribution.
- Average is not amortized: average is probabilistic over inputs; amortized is a worst-case guarantee averaged over a sequence of operations.
- Choose by risk: optimize worst case when tail latency or adversaries bite (heapsort, guaranteed bounds); optimize average case for throughput when bad inputs are rare (quicksort, hash tables).
🤖 Don't fully get this? Learn it with Claude
Stuck on Best, Worst, and Average Cases? Open Claude, copy a block below, and it'll teach you this exact concept — visually and interactively.
Build the mental picture, not memorization.
I just read a lesson on **Best, Worst, and Average Cases** (DSA) and want to truly understand it. Explain Best, Worst, and Average Cases from first principles using ONE vivid real-world analogy and a visual mental model — draw it as ASCII art or a clear step-by-step diagram — with a concrete example using real numbers. Then ask me one question to check I got the mental picture, and wait for my reply. If you're unsure or a claim isn't standard, say so and reason from first principles instead of guessing.
Socratic — adapts to where you're stuck.
Teach me **Best, Worst, and Average Cases** interactively. Ask me ONE guiding question at a time, wait for my answer, and adapt to my confusion — build the idea with me step by step instead of explaining it all at once. If you're unsure or a claim isn't standard, say so and reason from first principles instead of guessing.
Active recall exposes what you missed.
Quiz me on **Best, Worst, and Average Cases** with 5 questions, easy to tricky, ONE at a time. Tell me if each answer is right; at the end, explain clearly what I got wrong and why. If you're unsure or a claim isn't standard, say so and reason from first principles instead of guessing.
Intuition + hook + flashcards for long-term memory.
Help me remember **Best, Worst, and Average Cases** for the long term: give the one-sentence intuition, a memorable hook/mnemonic, a tiny worked example, and 3 active-recall flashcards (Q -> A). If you're unsure or a claim isn't standard, say so and reason from first principles instead of guessing.