Measuring Efficiency
Measuring Efficiency
There are exactly two ways to know which of two algorithms is faster, and they answer different questions. You can measure it — run both, time them — or you can analyze it — count how the work grows with input size. Beginners reach for the stopwatch and stop there. This page is about why that is a trap, where the stopwatch is genuinely the only tool that works, and the precise point at which the two methods disagree.
The one-sentence version: analysis tells you which algorithm wins as the data grows; measurement tells you which wins on the data you have today. These are not the same algorithm, and confusing them ships slow software.
The two rulers, and what each cannot see
| Empirical (benchmark/profile) | Analytical (asymptotic bound) | |
|---|---|---|
| Measures | wall-clock time = constant × growth-class, on one machine and one input | the growth class alone (constants dropped) |
| Blind to | what happens at 10× or 1000× the input you tested | constant factors, cache behaviour, the machine, small-n reality |
| Good for | ranking two algorithms in the same class; finding the real constant; catching cache/GC surprises | rejecting a bad class before writing code; guaranteeing behaviour at scale |
A benchmark that says "algorithm A is faster" is really saying "A is faster on this input, on this CPU, today." That is why "faster on my machine" is not a complexity claim. A slow language running a lower-class algorithm crushes a fast language running a higher-class one — but only once the input is big enough, and a single benchmark cannot tell you whether you are past that point. The growth classes themselves and the formal definition are catalogued on Functions and Their Growth Rates and Big-O Notation.
The crossover: where constants beat the better class (worked)
This is the single most important number in this topic and the reason you need both rulers. Compare two sorts:
- A — an in-place, cache-friendly
O(n2)like insertion sort. Tiny constant; model its cost asTA(n) = n2. - B — an
O(n log n)mergesort, but paying a fat per-element constant for allocation, recursion, and pointer-chasing. Model it asTB(n) = 50 · n · log2n.
Analysis says B wins — eventually. But when? Set the costs equal:
n2 = 50·n·log2n ⇒ n = 50·log2n
Solve numerically: at n = 430, 50·log2430 ≈ 437 — still larger than n, so A is faster. At n = 440, 50·log2440 ≈ 439 < 440 — B pulls ahead. The crossover is n* ≈ 440. For every input below ~440 elements, the "worse" quadratic algorithm is genuinely faster; only above it does the better class matter. Benchmark on n = 100 and you would confidently ship the O(n2) and get destroyed in production at n = 105; trust analysis alone and you would ship the mergesort and be needlessly slow on every small array. Only using both is correct — which is exactly why real sort libraries are hybrids that fall back to insertion sort on small subarrays and switch to an O(n log n) method above a measured threshold.
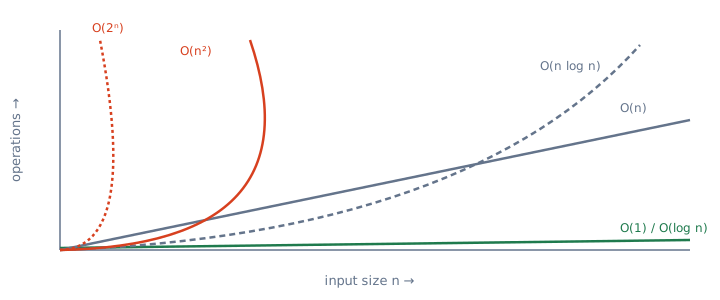
Step through the growth curves interactively below — watch how the flat and linear classes stay glued to the axis while the quadratic and exponential curves become walls. The interactive plots the classes; the crossover above is what a real benchmark of two implementations would reveal on top of them.
Benchmarking honestly — the traps that fake a measurement
Because a benchmark is one point on the constant×class curve, a sloppy benchmark lies confidently. The discipline:
- Measure across sizes, not one size. A single
ntells you nothing about growth. Time atn, 2n, 4n, 8nand watch the ratio: ~2× per doubling is linear, ~4× is quadratic. The slope is the empirical growth class. - Warm up first. On JIT runtimes (JVM, V8) the first runs execute interpreted, cold-cache code; timing them measures the compiler, not the algorithm. Discard warmup iterations.
- Benchmark the worst case, not a lucky input. Quicksort on already-sorted data hits its
O(n2)path; a random-input benchmark hides it. - Isolate the machine. Background load, CPU frequency scaling, and garbage collection add noise that can dwarf the effect you are measuring — take medians of many runs, not one wall-clock reading.
- Remember the cache. Two same-class algorithms can differ several-fold purely on memory-access pattern — a constant the analysis dropped but the profiler exposes (see the cost-model discussion on Introduction to Algorithm Analysis).
Key takeaways
- Two rulers, two questions. Analysis ranks algorithms as data grows; benchmarking ranks them on today's input. Neither alone is enough.
- "Faster on my machine" is not a complexity claim — it is a single point on a constant×class curve and says nothing about scale.
- The crossover is real and computable: an
O(n2)with a tiny constant beats anO(n log n)with a 50× constant up ton ≈ 440— which is why production sorts are hybrids. - Benchmark across sizes, warm up, use the worst case, take medians — measure the growth slope, not one lucky number.
🤖 Don't fully get this? Learn it with Claude
Stuck on Measuring Efficiency? Open Claude, copy a block below, and it'll teach you this exact concept — visually and interactively.
Build the mental picture, not memorization.
I just read a lesson on **Measuring Efficiency** (DSA) and want to truly understand it. Explain Measuring Efficiency from first principles using ONE vivid real-world analogy and a visual mental model — draw it as ASCII art or a clear step-by-step diagram — with a concrete example using real numbers. Then ask me one question to check I got the mental picture, and wait for my reply. If you're unsure or a claim isn't standard, say so and reason from first principles instead of guessing.
Socratic — adapts to where you're stuck.
Teach me **Measuring Efficiency** interactively. Ask me ONE guiding question at a time, wait for my answer, and adapt to my confusion — build the idea with me step by step instead of explaining it all at once. If you're unsure or a claim isn't standard, say so and reason from first principles instead of guessing.
Active recall exposes what you missed.
Quiz me on **Measuring Efficiency** with 5 questions, easy to tricky, ONE at a time. Tell me if each answer is right; at the end, explain clearly what I got wrong and why. If you're unsure or a claim isn't standard, say so and reason from first principles instead of guessing.
Intuition + hook + flashcards for long-term memory.
Help me remember **Measuring Efficiency** for the long term: give the one-sentence intuition, a memorable hook/mnemonic, a tiny worked example, and 3 active-recall flashcards (Q -> A). If you're unsure or a claim isn't standard, say so and reason from first principles instead of guessing.